PowerHouse SwiftEdge AI v2.10 StrategyOverview
The PowerHouse SwiftEdge AI v2.10 Strategy is a sophisticated trading system designed to identify high-probability trade setups in forex, stocks, and cryptocurrencies. By combining multi-timeframe trend analysis, momentum signals, volume confirmation, and smart money concepts (Change of Character and Break of Structure ), this strategy offers traders a robust tool to capitalize on market trends while minimizing false signals. The strategy’s unique “AI” component analyzes trends across multiple timeframes to provide a clear, actionable dashboard, making it accessible for both novice and experienced traders. The strategy is fully customizable, allowing users to tailor its filters to their trading style.
What It Does
This strategy generates Buy and Sell signals based on a confluence of technical indicators and smart money concepts. It uses:
Multi-Timeframe Trend Analysis: Confirms the market’s direction by analyzing trends on the 1-hour (60M), 4-hour (240M), and daily (D) timeframes.
Momentum Filter: Ensures trades align with strong price movements to avoid choppy markets.
Volume Filter: Validates signals with above-average volume to confirm market participation.
Breakout Filter: Requires price to break key levels for added confirmation.
Smart Money Signals (CHoCH/BOS): Identifies reversals (CHoCH) and trend continuations (BOS) based on pivot points.
AI Trend Dashboard: Summarizes trend strength, confidence, and predictions across timeframes, helping traders make informed decisions without needing to analyze complex data manually.
The strategy also plots dynamic support and resistance trendlines, take-profit (TP) levels, and “Get Ready” signals to alert users of potential setups before they fully develop. Trades are executed with predefined take-profit and stop-loss levels for disciplined risk management.
How It Works
The strategy integrates multiple components to create a cohesive trading system:
Multi-Timeframe Trend Analysis:
The strategy evaluates trends on three timeframes (1H, 4H, Daily) using Exponential Moving Averages (EMA) and Volume-Weighted Average Price (VWAP). A trend is considered bullish if the price is above both the EMA and VWAP, bearish if below, or neutral otherwise.
Signals are only generated when the trend on the user-selected higher timeframe aligns with the trade direction (e.g., Buy signals require a bullish higher timeframe trend). This reduces noise and ensures trades follow the broader market context.
Momentum Filter:
Measures the percentage price change between consecutive bars and compares it to a volatility-adjusted threshold (based on the Average True Range ). This ensures trades are taken only during significant price movements, filtering out low-momentum conditions.
Volume Filter (Optional):
Checks if the current volume exceeds a long-term average and shows positive short-term volume change. This confirms strong market participation, reducing the risk of false breakouts.
Breakout Filter (Optional):
Requires the price to break above (for Buy) or below (for Sell) recent highs/lows, ensuring the signal aligns with a structural shift in the market.
Smart Money Concepts (CHoCH/BOS):
Change of Character (CHoCH): Detects potential reversals when the price crosses under a recent pivot high (for Sell) or over a recent pivot low (for Buy) with a bearish or bullish candle, respectively.
Break of Structure (BOS): Confirms trend continuations when the price breaks below a recent pivot low (for Sell) or above a recent pivot high (for Buy) with strong momentum.
These signals are plotted as horizontal lines with labels, making it easy to visualize key levels.
AI Trend Dashboard:
Combines trend direction, momentum, and volatility (ATR) across timeframes to calculate a trend score. Scores above 0.5 indicate an “Up” trend, below -0.5 indicate a “Down” trend, and otherwise “Neutral.”
Displays a table summarizing trend strength (as a percentage), AI confidence (based on trend alignment), and Cumulative Volume Delta (CVD) for market context.
A second table (optional) shows trend predictions for 1H, 4H, and Daily timeframes, helping traders anticipate future market direction.
Dynamic Trendlines:
Plots support and resistance lines based on recent swing lows and highs within user-defined periods (shortTrendPeriod, longTrendPeriod). These lines adapt to market conditions and are colored based on trend strength.
Why This Combination?
The PowerHouse SwiftEdge AI v2.10 Strategy is original because it seamlessly integrates traditional technical analysis (EMA, VWAP, ATR, volume) with smart money concepts (CHoCH, BOS) and a proprietary AI-driven trend analysis. Unlike standalone indicators, this strategy:
Reduces False Signals: By requiring confluence across trend, momentum, volume, and breakout filters, it minimizes trades in choppy or low-conviction markets.
Adapts to Market Context: The ATR-based momentum threshold adjusts dynamically to volatility, ensuring signals remain relevant in both trending and ranging markets.
Simplifies Decision-Making: The AI dashboard distills complex multi-timeframe data into a user-friendly table, eliminating the need for manual analysis.
Leverages Smart Money: CHoCH and BOS signals capture institutional price action patterns, giving traders an edge in identifying reversals and continuations.
The combination of these components creates a balanced system that aligns short-term trade entries with longer-term market trends, offering a unique blend of precision, adaptability, and clarity.
How to Use
Add to Chart:
Apply the strategy to your TradingView chart on a liquid symbol (e.g., EURUSD, BTCUSD, AAPL) with a timeframe of 60 minutes or lower (e.g., 15M, 60M).
Configure Inputs:
Pivot Length: Adjust the number of bars (default: 5) to detect pivot highs/lows for CHoCH/BOS signals. Higher values reduce noise but may delay signals.
Momentum Threshold: Set the base percentage (default: 0.01%) for momentum confirmation. Increase for stricter signals.
Take Profit/Stop Loss: Define TP and SL in points (default: 10 each) for risk management.
Higher/Lower Timeframe: Choose timeframes (60M, 240M, D) for trend filtering. Ensure the chart timeframe is lower than or equal to the higher timeframe.
Filters: Enable/disable momentum, volume, or breakout filters to suit your trading style.
Trend Periods: Set shortTrendPeriod (default: 30) and longTrendPeriod (default: 100) for trendline plotting. Keep below 2000 to avoid buffer errors.
AI Dashboard: Toggle Enable AI Market Analysis to show/hide the prediction table and adjust its position.
Interpret Signals:
Buy/Sell Labels: Green "Buy" or red "Sell" labels indicate trade entries with predefined TP/SL levels plotted.
Get Ready Signals: Yellow "Get Ready BUY" or orange "Get Ready SELL" labels warn of potential setups.
CHoCH/BOS Lines: Aqua (CHoCH Sell), lime (CHoCH Buy), fuchsia (BOS Sell), or teal (BOS Buy) lines mark key levels.
Trendlines: Green/lime (support) or fuchsia/purple (resistance) dashed lines show dynamic support/resistance.
AI Dashboard: Check the top-right table for trend strength, confidence, and CVD. The optional bottom table shows trend predictions (Up, Down, Neutral).
Backtest and Trade:
Use TradingView’s Strategy Tester to evaluate performance. Adjust TP/SL and filters based on results.
Trade manually based on signals or automate with TradingView alerts (set alerts for Buy/Sell labels).
Originality and Value
The PowerHouse SwiftEdge AI v2.10 Strategy stands out by combining multi-timeframe analysis, smart money concepts, and an AI-driven dashboard into a single, user-friendly system. Its adaptive momentum threshold, robust filtering, and clear visualizations empower traders to make confident decisions without needing advanced technical knowledge. Whether you’re a day trader or swing trader, this strategy provides a versatile, data-driven approach to navigating dynamic markets.
Important Notes:
Risk Management: Always use appropriate position sizing and risk management, as the strategy’s TP/SL levels are customizable.
Symbol Compatibility: Test on liquid symbols with sufficient historical data (at least 2000 bars) to avoid buffer errors.
Performance: Backtest thoroughly to optimize settings for your market and timeframe.
Cerca negli script per "Buy sell"

WhispererRealtimeVolumeLibrary "WhispererRealtimeVolume"
▮ Overview
The Whisperer Realtime Volume Library is a lightweight and reusable Pine Script® library designed for real-time volume analysis.
It calculates up, down, and neutral volumes dynamically, making it an essential tool for traders who want to gain deeper insights into market activity.
This library is a simplified and modular version of the original "Realtime Volume Bars w Market Buy/Sell/Neutral split & Mkt Delta" indicator by the_MarketWhisperer , tailored for integration into custom scripts.
How bars are classified
- Up Bars
If the current bar’s closing price is higher than the previous bar’s closing price, it is classified as an up bar.
Volume handling:
The increase in volume for this bar is added to the up volume.
This represents buying pressure.
- Down Bars
If the current bar’s closing price is lower than the previous bar’s closing price, it is classified as a down bar.
Volume handling:
The increase in volume for this bar is added to the down volume.
This represents selling pressure.
- Neutral Bars
If the current bar’s closing price is the same as the previous bar’s closing price, it is classified as a neutral bar.
Volume handling:
If neutral volume is enabled, the volume is added to the neutral volume.
If neutral volume is not enabled, the volume is assigned to the same direction as the previous bar (up or down). If the previous direction is unknown, it is added to the neutral volume.
▮ What to look for
Real-Time Volume Calculation : Analyze up, down, and neutral volumes in real-time based on price movements and bar volume.
Customizable Start Line : Add a visual reference line to your chart for better context by viewing the starting point of real-time bars.
Ease of Integration : Designed as a library for seamless use in other Pine Script® indicators or strategies.
▮ How to use
Example code:
//@version=6
indicator("Volume Realtime from Whisperer")
import andre_007/WhispererRealtimeVolume/4 as MW
MW.displayStartLine(startLineColor = color.gray, startLineWidth = 1, startLineStyle = line.style_dashed,
displayStartLine = true, y1=volume, y2=volume + 10)
= MW.mw_upDownVolumeRealtime(true)
plot(volume, style=plot.style_columns, color=color.gray)
plot(volumeUp, style=plot.style_columns, color=color.green)
plot(volumeDown, style=plot.style_columns, color=color.red)
plot(volumeNeutral, style=plot.style_columns, color=color.purple)
▮ Credits
This library is inspired by the original work of the_MarketWhisperer , whose "Realtime Volume Bars" indicator served as the foundation.
Link to original indicator :

RSI Full Forecast [Titans_Invest]RSI Full Forecast
Get ready to experience the ultimate evolution of RSI-based indicators – the RSI Full Forecast, a boosted and even smarter version of the already powerful: RSI Forecast
Now featuring over 40 additional entry conditions (forecasts), this indicator redefines the way you view the market.
AI-Powered RSI Forecasting:
Using advanced linear regression with the least squares method – a solid foundation for machine learning - the RSI Full Forecast enables you to predict future RSI behavior with impressive accuracy.
But that’s not all: this new version also lets you monitor future crossovers between the RSI and the MA RSI, delivering early and strategic signals that go far beyond traditional analysis.
You’ll be able to monitor future crossovers up to 20 bars ahead, giving you an even broader and more precise view of market movements.
See the Future, Now:
• Track upcoming RSI & RSI MA crossovers in advance.
• Identify potential reversal zones before price reacts.
• Uncover statistical behavior patterns that would normally go unnoticed.
40+ Intelligent Conditions:
The new layer of conditions is designed to detect multiple high-probability scenarios based on historical patterns and predictive modeling. Each additional forecast is a window into the price's future, powered by robust mathematics and advanced algorithmic logic.
Full Customization:
All parameters can be tailored to fit your strategy – from smoothing periods to prediction sensitivity. You have complete control to turn raw data into smart decisions.
Innovative, Accurate, Unique:
This isn’t just an upgrade. It’s a quantum leap in technical analysis.
RSI Full Forecast is the first of its kind: an indicator that blends statistical analysis, machine learning, and visual design to create a true real-time predictive system.
⯁ SCIENTIFIC BASIS LINEAR REGRESSION
Linear Regression is a fundamental method of statistics and machine learning, used to model the relationship between a dependent variable y and one or more independent variables 𝑥.
The general formula for a simple linear regression is given by:
y = β₀ + β₁x + ε
β₁ = Σ((xᵢ - x̄)(yᵢ - ȳ)) / Σ((xᵢ - x̄)²)
β₀ = ȳ - β₁x̄
Where:
y = is the predicted variable (e.g. future value of RSI)
x = is the explanatory variable (e.g. time or bar index)
β0 = is the intercept (value of 𝑦 when 𝑥 = 0)
𝛽1 = is the slope of the line (rate of change)
ε = is the random error term
The goal is to estimate the coefficients 𝛽0 and 𝛽1 so as to minimize the sum of the squared errors — the so-called Random Error Method Least Squares.
⯁ LEAST SQUARES ESTIMATION
To minimize the error between predicted and observed values, we use the following formulas:
β₁ = /
β₀ = ȳ - β₁x̄
Where:
∑ = sum
x̄ = mean of x
ȳ = mean of y
x_i, y_i = individual values of the variables.
Where:
x_i and y_i are the means of the independent and dependent variables, respectively.
i ranges from 1 to n, the number of observations.
These equations guarantee the best linear unbiased estimator, according to the Gauss-Markov theorem, assuming homoscedasticity and linearity.
⯁ LINEAR REGRESSION IN MACHINE LEARNING
Linear regression is one of the cornerstones of supervised learning. Its simplicity and ability to generate accurate quantitative predictions make it essential in AI systems, predictive algorithms, time series analysis, and automated trading strategies.
By applying this model to the RSI, you are literally putting artificial intelligence at the heart of a classic indicator, bringing a new dimension to technical analysis.
⯁ VISUAL INTERPRETATION
Imagine an RSI time series like this:
Time →
RSI →
The regression line will smooth these values and extend them n periods into the future, creating a predicted trajectory based on the historical moment. This line becomes the predicted RSI, which can be crossed with the actual RSI to generate more intelligent signals.
⯁ SUMMARY OF SCIENTIFIC CONCEPTS USED
Linear Regression Models the relationship between variables using a straight line.
Least Squares Minimizes the sum of squared errors between prediction and reality.
Time Series Forecasting Estimates future values based on historical data.
Supervised Learning Trains models to predict outputs from known inputs.
Statistical Smoothing Reduces noise and reveals underlying trends.
⯁ WHY THIS INDICATOR IS REVOLUTIONARY
Scientifically-based: Based on statistical theory and mathematical inference.
Unprecedented: First public RSI with least squares predictive modeling.
Intelligent: Built with machine learning logic.
Practical: Generates forward-thinking signals.
Customizable: Flexible for any trading strategy.
⯁ CONCLUSION
By combining RSI with linear regression, this indicator allows a trader to predict market momentum, not just follow it.
RSI Full Forecast is not just an indicator — it is a scientific breakthrough in technical analysis technology.
⯁ Example of simple linear regression, which has one independent variable:
⯁ In linear regression, observations ( red ) are considered to be the result of random deviations ( green ) from an underlying relationship ( blue ) between a dependent variable ( y ) and an independent variable ( x ).
⯁ Visualizing heteroscedasticity in a scatterplot against 100 random fitted values using Matlab:
⯁ The data sets in the Anscombe's quartet are designed to have approximately the same linear regression line (as well as nearly identical means, standard deviations, and correlations) but are graphically very different. This illustrates the pitfalls of relying solely on a fitted model to understand the relationship between variables.
⯁ The result of fitting a set of data points with a quadratic function:
_________________________________________________
🔮 Linear Regression: PineScript Technical Parameters 🔮
_________________________________________________
Forecast Types:
• Flat: Assumes prices will remain the same.
• Linreg: Makes a 'Linear Regression' forecast for n periods.
Technical Information:
ta.linreg (built-in function)
Linear regression curve. A line that best fits the specified prices over a user-defined time period. It is calculated using the least squares method. The result of this function is calculated using the formula: linreg = intercept + slope * (length - 1 - offset), where intercept and slope are the values calculated using the least squares method on the source series.
Syntax:
• Function: ta.linreg()
Parameters:
• source: Source price series.
• length: Number of bars (period).
• offset: Offset.
• return: Linear regression curve.
This function has been cleverly applied to the RSI, making it capable of projecting future values based on past statistical trends.
______________________________________________________
______________________________________________________
⯁ WHAT IS THE RSI❓
The Relative Strength Index (RSI) is a technical analysis indicator developed by J. Welles Wilder. It measures the magnitude of recent price movements to evaluate overbought or oversold conditions in a market. The RSI is an oscillator that ranges from 0 to 100 and is commonly used to identify potential reversal points, as well as the strength of a trend.
⯁ HOW TO USE THE RSI❓
The RSI is calculated based on average gains and losses over a specified period (usually 14 periods). It is plotted on a scale from 0 to 100 and includes three main zones:
• Overbought: When the RSI is above 70, indicating that the asset may be overbought.
• Oversold: When the RSI is below 30, indicating that the asset may be oversold.
• Neutral Zone: Between 30 and 70, where there is no clear signal of overbought or oversold conditions.
______________________________________________________
______________________________________________________
⯁ ENTRY CONDITIONS
The conditions below are fully flexible and allow for complete customization of the signal.
______________________________________________________
______________________________________________________
🔹 CONDITIONS TO BUY 📈
______________________________________________________
• Signal Validity: The signal will remain valid for X bars .
• Signal Sequence: Configurable as AND or OR .
📈 RSI Conditions:
🔹 RSI > Upper
🔹 RSI < Upper
🔹 RSI > Lower
🔹 RSI < Lower
🔹 RSI > Middle
🔹 RSI < Middle
🔹 RSI > MA
🔹 RSI < MA
📈 MA Conditions:
🔹 MA > Upper
🔹 MA < Upper
🔹 MA > Lower
🔹 MA < Lower
📈 Crossovers:
🔹 RSI (Crossover) Upper
🔹 RSI (Crossunder) Upper
🔹 RSI (Crossover) Lower
🔹 RSI (Crossunder) Lower
🔹 RSI (Crossover) Middle
🔹 RSI (Crossunder) Middle
🔹 RSI (Crossover) MA
🔹 RSI (Crossunder) MA
🔹 MA (Crossover) Upper
🔹 MA (Crossunder) Upper
🔹 MA (Crossover) Lower
🔹 MA (Crossunder) Lower
📈 RSI Divergences:
🔹 RSI Divergence Bull
🔹 RSI Divergence Bear
📈 RSI Forecast:
🔹 RSI (Crossover) MA Forecast
🔹 RSI (Crossunder) MA Forecast
🔹 RSI Forecast 1 > MA Forecast 1
🔹 RSI Forecast 1 < MA Forecast 1
🔹 RSI Forecast 2 > MA Forecast 2
🔹 RSI Forecast 2 < MA Forecast 2
🔹 RSI Forecast 3 > MA Forecast 3
🔹 RSI Forecast 3 < MA Forecast 3
🔹 RSI Forecast 4 > MA Forecast 4
🔹 RSI Forecast 4 < MA Forecast 4
🔹 RSI Forecast 5 > MA Forecast 5
🔹 RSI Forecast 5 < MA Forecast 5
🔹 RSI Forecast 6 > MA Forecast 6
🔹 RSI Forecast 6 < MA Forecast 6
🔹 RSI Forecast 7 > MA Forecast 7
🔹 RSI Forecast 7 < MA Forecast 7
🔹 RSI Forecast 8 > MA Forecast 8
🔹 RSI Forecast 8 < MA Forecast 8
🔹 RSI Forecast 9 > MA Forecast 9
🔹 RSI Forecast 9 < MA Forecast 9
🔹 RSI Forecast 10 > MA Forecast 10
🔹 RSI Forecast 10 < MA Forecast 10
🔹 RSI Forecast 11 > MA Forecast 11
🔹 RSI Forecast 11 < MA Forecast 11
🔹 RSI Forecast 12 > MA Forecast 12
🔹 RSI Forecast 12 < MA Forecast 12
🔹 RSI Forecast 13 > MA Forecast 13
🔹 RSI Forecast 13 < MA Forecast 13
🔹 RSI Forecast 14 > MA Forecast 14
🔹 RSI Forecast 14 < MA Forecast 14
🔹 RSI Forecast 15 > MA Forecast 15
🔹 RSI Forecast 15 < MA Forecast 15
🔹 RSI Forecast 16 > MA Forecast 16
🔹 RSI Forecast 16 < MA Forecast 16
🔹 RSI Forecast 17 > MA Forecast 17
🔹 RSI Forecast 17 < MA Forecast 17
🔹 RSI Forecast 18 > MA Forecast 18
🔹 RSI Forecast 18 < MA Forecast 18
🔹 RSI Forecast 19 > MA Forecast 19
🔹 RSI Forecast 19 < MA Forecast 19
🔹 RSI Forecast 20 > MA Forecast 20
🔹 RSI Forecast 20 < MA Forecast 20
______________________________________________________
______________________________________________________
🔸 CONDITIONS TO SELL 📉
______________________________________________________
• Signal Validity: The signal will remain valid for X bars .
• Signal Sequence: Configurable as AND or OR .
📉 RSI Conditions:
🔸 RSI > Upper
🔸 RSI < Upper
🔸 RSI > Lower
🔸 RSI < Lower
🔸 RSI > Middle
🔸 RSI < Middle
🔸 RSI > MA
🔸 RSI < MA
📉 MA Conditions:
🔸 MA > Upper
🔸 MA < Upper
🔸 MA > Lower
🔸 MA < Lower
📉 Crossovers:
🔸 RSI (Crossover) Upper
🔸 RSI (Crossunder) Upper
🔸 RSI (Crossover) Lower
🔸 RSI (Crossunder) Lower
🔸 RSI (Crossover) Middle
🔸 RSI (Crossunder) Middle
🔸 RSI (Crossover) MA
🔸 RSI (Crossunder) MA
🔸 MA (Crossover) Upper
🔸 MA (Crossunder) Upper
🔸 MA (Crossover) Lower
🔸 MA (Crossunder) Lower
📉 RSI Divergences:
🔸 RSI Divergence Bull
🔸 RSI Divergence Bear
📉 RSI Forecast:
🔸 RSI (Crossover) MA Forecast
🔸 RSI (Crossunder) MA Forecast
🔸 RSI Forecast 1 > MA Forecast 1
🔸 RSI Forecast 1 < MA Forecast 1
🔸 RSI Forecast 2 > MA Forecast 2
🔸 RSI Forecast 2 < MA Forecast 2
🔸 RSI Forecast 3 > MA Forecast 3
🔸 RSI Forecast 3 < MA Forecast 3
🔸 RSI Forecast 4 > MA Forecast 4
🔸 RSI Forecast 4 < MA Forecast 4
🔸 RSI Forecast 5 > MA Forecast 5
🔸 RSI Forecast 5 < MA Forecast 5
🔸 RSI Forecast 6 > MA Forecast 6
🔸 RSI Forecast 6 < MA Forecast 6
🔸 RSI Forecast 7 > MA Forecast 7
🔸 RSI Forecast 7 < MA Forecast 7
🔸 RSI Forecast 8 > MA Forecast 8
🔸 RSI Forecast 8 < MA Forecast 8
🔸 RSI Forecast 9 > MA Forecast 9
🔸 RSI Forecast 9 < MA Forecast 9
🔸 RSI Forecast 10 > MA Forecast 10
🔸 RSI Forecast 10 < MA Forecast 10
🔸 RSI Forecast 11 > MA Forecast 11
🔸 RSI Forecast 11 < MA Forecast 11
🔸 RSI Forecast 12 > MA Forecast 12
🔸 RSI Forecast 12 < MA Forecast 12
🔸 RSI Forecast 13 > MA Forecast 13
🔸 RSI Forecast 13 < MA Forecast 13
🔸 RSI Forecast 14 > MA Forecast 14
🔸 RSI Forecast 14 < MA Forecast 14
🔸 RSI Forecast 15 > MA Forecast 15
🔸 RSI Forecast 15 < MA Forecast 15
🔸 RSI Forecast 16 > MA Forecast 16
🔸 RSI Forecast 16 < MA Forecast 16
🔸 RSI Forecast 17 > MA Forecast 17
🔸 RSI Forecast 17 < MA Forecast 17
🔸 RSI Forecast 18 > MA Forecast 18
🔸 RSI Forecast 18 < MA Forecast 18
🔸 RSI Forecast 19 > MA Forecast 19
🔸 RSI Forecast 19 < MA Forecast 19
🔸 RSI Forecast 20 > MA Forecast 20
🔸 RSI Forecast 20 < MA Forecast 20
______________________________________________________
______________________________________________________
🤖 AUTOMATION 🤖
• You can automate the BUY and SELL signals of this indicator.
______________________________________________________
______________________________________________________
⯁ UNIQUE FEATURES
______________________________________________________
Linear Regression: (Forecast)
Signal Validity: The signal will remain valid for X bars
Signal Sequence: Configurable as AND/OR
Condition Table: BUY/SELL
Condition Labels: BUY/SELL
Plot Labels in the Graph Above: BUY/SELL
Automate and Monitor Signals/Alerts: BUY/SELL
Linear Regression (Forecast)
Signal Validity: The signal will remain valid for X bars
Signal Sequence: Configurable as AND/OR
Condition Table: BUY/SELL
Condition Labels: BUY/SELL
Plot Labels in the Graph Above: BUY/SELL
Automate and Monitor Signals/Alerts: BUY/SELL
______________________________________________________
📜 SCRIPT : RSI Full Forecast
🎴 Art by : @Titans_Invest & @DiFlip
👨💻 Dev by : @Titans_Invest & @DiFlip
🎑 Titans Invest — The Wizards Without Gloves 🧤
✨ Enjoy!
______________________________________________________
o Mission 🗺
• Inspire Traders to manifest Magic in the Market.
o Vision 𐓏
• To elevate collective Energy 𐓷𐓏

Cointegration Buy and Sell Signals [EdgeTerminal]The Cointegration Buy And Sell Signals is a sophisticated technical analysis tool to spot high-probability market turning points — before they fully develop on price charts.
Most reversal indicators rely on raw price action, visual patterns, or basic and common indicator logic — which often suffer in noisy or trending markets. In most cases, they lag behind the actual change in trend and provide useless and late signals.
This indicator is rooted in advanced concepts from statistical arbitrage, mean reversion theory, and quantitative finance, and it packages these ideas in a user-friendly visual format that works on any timeframe and asset class.
It does this by analyzing how the short-term and long-term EMAs behave relative to each other — and uses statistical filters like Z-score, correlation, volatility normalization, and stationarity tests to issue highly selective Buy and Sell signals.
This tool provides statistical confirmation of trend exhaustion, allowing you to trade mean-reverting setups. It fades overextended moves and uses signal stacking to reduce false entries. The entire indicator is based on a very interesting mathematically grounded model which I will get into down below.
Here’s how the indicator works at a high level:
EMAs as Anchors: It starts with two Exponential Moving Averages (EMAs) — one short-term and one long-term — to track market direction.
Statistical Spread (Regression Residuals): It performs a rolling linear regression between the short and long EMA. Instead of using the raw difference (short - long), it calculates the regression residual, which better models their natural relationship.
Normalize the Spread: The spread is divided by historical price volatility (ATR) to make it scale-invariant. This ensures the indicator works on low-priced stocks, high-priced indices, and crypto alike.
Z-Score: It computes a Z-score of the normalized spread to measure how “extreme” the current deviation is from its historical average.
Dynamic Thresholds: Unlike most tools that use fixed thresholds (like Z = ±2), this one calculates dynamic thresholds using historical percentiles (e.g., top 10% and bottom 10%) so that it adapts to the asset's current behavior to reduce false signals based on market’s extreme volatility at a certain time.
Z-Score Momentum: It tracks the direction of the Z-score — if Z is extreme but still moving away from zero, it's too early. It waits for reversion to start (Z momentum flips).
Correlation Check: Uses a rolling Pearson correlation to confirm the two EMAs are still statistically related. If they diverge (low correlation), no signal is shown.
Stationarity Filter (ADF-like): Uses the volatility of the regression residual to determine if the spread is stationary (mean-reverting) — a key concept in cointegration and statistical arbitrage. It’s not possible to build an exact ADF filter in Pine Script so we used the next best thing.
Signal Control: Prevents noisy charts and overtrading by ensuring no back-to-back buy or sell signals. Each signal must alternate and respect a cooldown period so you won’t be overwhelmed and won’t get a messy chart.
Important Notes to Remember:
The whole idea behind this indicator is to try to use some stat arb models to detect shifting patterns faster than they appear on common indicators, so in some cases, some assumptions are made based on historic values.
This means that in some cases, the indicator can “jump” into the conclusion too quickly. Although we try to eliminate this by using stationary filters, correlation checks, and Z-score momentum detection, there is still a chance some signals that are generated can be too early, in the stock market, that's the same as being incorrect. So make sure to use this with other indicators to confirm the movement.
How To Use The Indicator:
You can use the indicator as a standalone reversal system, as a filter for overbought and oversold setups, in combination with other trend indicators and as a part of a signal stack with other common indicators for divergence spotting and fade trades.
The indicator produces simple buy and sell signals when all criteria is met. Based on our own testing, we recommend treating these signals as standalone and independent from each other . Meaning that if you take position after a buy signal, don’t wait for a sell signal to appear to exit the trade and vice versa.
This is why we recommend using this indicator with other advanced or even simple indicators as an early confirmation tool.
The Display Table:
The floating diagnostic table in the top-right corner of the chart is a key part of this indicator. It's a live statistical dashboard that helps you understand why a signal is (or isn’t) being triggered, and whether the market conditions are lining up for a potential reversal.
1. Z-Score
What it shows: The current Z-score value of the volatility-normalized spread between the short EMA and the regression line of the long EMA.
Why it matters: Z-score tells you how statistically extreme the current relationship is. A Z-score of:
0 = perfectly average
> +2 = very overbought
< -2 = very oversold
How to use it: Look for Z-score reaching extreme highs or lows (beyond dynamic thresholds). Watch for it to start reversing direction, especially when paired with green table rows (see below)
2. Z-Score Momentum
What it shows: The rate of change (ROC) of the Z-score:
Zmomentum=Zt − Zt − 1
Why it matters: This tells you if the Z-score is still stretching out (e.g., getting more overbought/oversold), or reverting back toward the mean.
How to use it: A positive Z-momentum after a very low Z-score = potential bullish reversal A negative Z-momentum after a very high Z-score = potential bearish reversal. Avoid signals when momentum is still pushing deeper into extremes
3. Correlation
What it shows: The rolling Pearson correlation coefficient between the short EMA and long EMA.
Why it matters: High correlation (closer to +1) means the EMAs are still statistically connected — a key requirement for cointegration or mean reversion to be valid.
How to use it: Look for correlation > 0.7 for reliable signals. If correlation drops below 0.5, ignore the Z-score — the EMAs aren’t moving together anymore
4. Stationary
What it shows: A simplified "Yes" or "No" answer to the question:
“Is the spread statistically stable (stationary) and mean-reverting right now?”
Why it matters: Mean reversion strategies only work when the spread is stationary — that is, when the distance between EMAs behaves like a rubber band, not a drifting cloud.
How to use it: A "Yes" means the indicator sees a consistent, stable spread — good for trading. "No" means the market is too volatile, disjointed, or chaotic for reliable mean reversion. Wait for this to flip to "Yes" before trusting signals
5. Last Signal
What it shows: The last signal issued by the system — either "Buy", "Sell", or "None"
Why it matters: Helps avoid confusion and repeated entries. Signals only alternate — you won’t get another Buy until a Sell happens, and vice versa.
How to use it: If the last signal was a "Buy", and you’re watching for a Sell, don’t act on more bullish signals. Great for systems where you only want one position open at a time
6. Bars Since Signal
What it shows: How many bars (candles) have passed since the last Buy or Sell signal.
Why it matters: Gives you context for how long the current condition has persisted
How to use it: If it says 1 or 2, a signal just happened — avoid jumping in late. If it’s been 10+ bars, a new opportunity might be brewing soon. You can use this to time exits if you want to fade a recent signal manually
Indicator Settings:
Short EMA: Sets the short-term EMA period. The smaller the number, the more reactive and more signals you get.
Long EMA: Sets the slow EMA period. The larger this number is, the smoother baseline, and more reliable trend bases are generated.
Z-Score Lookback: The period or bars used for mean & std deviation of spread between short and long EMAs. Larger values result in smoother signals with fewer false positives.
Volatility Window: This value normalizes the spread by historical volatility. This allows you to prevent scale distortion, showing you a cleaner and better chart.
Correlation Lookback: How many periods or how far back to test correlation between slow and long EMAs. This filters out false positives when EMAs lose alignment.
Hurst Lookback: The multiplier to approximate stationarity. Lower leads to more sensitivity to regime change, higher produces a more stricter filtering.
Z Threshold Percentile: This value sets how extreme Z-score must be to trigger a signal. For example, 90 equals only top/bottom 10% of extremes, 80 = more frequent.
Min Bars Between Signals: This hard stop prevents back-to-back signals. The idea is to avoid over-trading or whipsaws in volatile markets even when Hurst lookback and volatility window values are not enough to filter signals.
Some More Recommendations:
We recommend trying different EMA pairs (10/50, 21/100, 5/20) for different asset behaviors. You can set percentile to 85 or 80 if you want more frequent but looser signals. You can also use the Z-score reversion monitor for powerful confirmation.

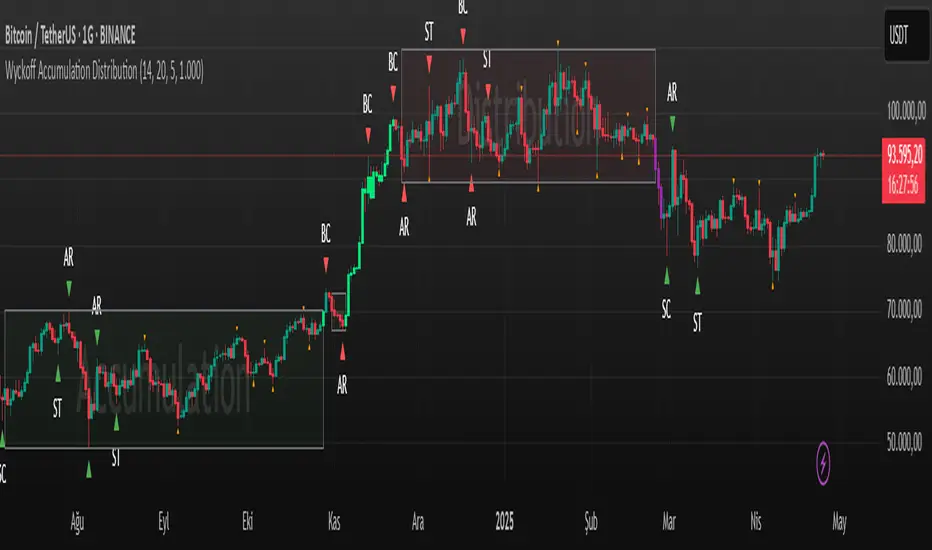
Wyckoff Accumulation Distribution Wyckoff Accumulation & Distribution Indicator (RSI-Based)
This Pine Script is a technical analysis indicator built around the Wyckoff Method, designed to detect accumulation and distribution phases using RSI (Relative Strength Index) and pivot points. It automatically marks key structural turning points on the chart and highlights relevant zones with colored boxes.
What Does It Do?
Draws accumulation and distribution boxes based on RSI behavior.
Automatically detects Wyckoff structural signals:
SC (Selling Climax)
AR (Automatic Rally)
ST (Secondary Test)
BC (Buying Climax)
DAR (Automatic Reaction)
DST (Secondary Test - Distribution)
Identifies trend transitions by detecting sideways RSI movement.
Attempts to detect spring and UTAD-like deviations based on RSI reversals.
Uses RSI extremes in conjunction with pivot points to generate Wyckoff signals.
How Does It Work?
RSI Zone: It identifies sideways markets when RSI stays within ±20 of the 50 level (this range is configurable).
Pivot Points: It detects pivot highs/lows that sync with RSI values (pivotLen is adjustable).
Trend Box Drawing:
When RSI exits the sideways zone, the script draws a gray box between the highest high and lowest low within that range.
If RSI breaks upward, the box becomes green (Accumulation); if downward, it becomes red (Distribution).
Wyckoff Structural Points:
SC/BC: Detected when a pivot occurs with RSI below/above a threshold.
AR/DAR: The next opposite pivot after SC or BC.
ST/DST: The next same-direction pivot after AR or DAR.
How to Use It
Works best on 4H or daily charts for more reliable signals. Shorter timeframes may generate noise.
Primarily used for interpreting RSI structures through the lens of Wyckoff methodology.
Box colors help quickly identify market phase:
Green box: Likely Accumulation
Red box: Likely Distribution
Triangular markers show key signals:
SC, AR, ST: Accumulation points
BC, DAR, DST: Distribution points
Use these signals alongside price action to manually interpret Wyckoff phases.
image.binance.vision
image.binance.vision
What Is the Wyckoff Method?
The Wyckoff Method, developed in the 1930s by Richard Wyckoff, is a market analysis approach that focuses on supply and demand dynamics behind price movements.
Wyckoff’s 5 Phases:
Accumulation: Smart money gradually buying at low prices.
Markup: Price begins trending upwards.
Distribution: Smart money selling to retail traders.
Markdown: Downtrend begins as supply outweighs demand.
Re-accumulation / Re-distribution: Trend-continuation phases with consolidations.
This indicator is specifically designed to detect phase 1 (Accumulation) and phase 3 (Distribution).
Extra Notes
Repainting is minimal, as pivots are confirmed using historical candles.
Labels use plotshape for a clean, minimalist visual style.
Other Wyckoff events (like SOS, LPS, UT, UTAD) could be added in future updates.
This script does not generate buy/sell signals; it is meant for structural interpretation.
Order Flow Delta Trackerorderflow manager where you
Delta bars: Show net buying/selling per candle.
Cumulative Delta: Helps identify hidden buying/selling pressure.
If price rises but cumulative delta falls → possible hidden selling (divergence).
If price falls but cumulative delta rises → hidden buying.

RSI Forecast [Titans_Invest]RSI Forecast
Introducing one of the most impressive RSI indicators ever created – arguably the best on TradingView, and potentially the best in the world.
RSI Forecast is a visionary evolution of the classic RSI, merging powerful customization with groundbreaking predictive capabilities. While preserving the core principles of traditional RSI, it takes analysis to the next level by allowing users to anticipate potential future RSI movements.
Real-Time RSI Forecasting:
For the first time ever, an RSI indicator integrates linear regression using the least squares method to accurately forecast the future behavior of the RSI. This innovation empowers traders to stay one step ahead of the market with forward-looking insight.
Highly Customizable:
Easily adapt the indicator to your personal trading style. Fine-tune a variety of parameters to generate signals perfectly aligned with your strategy.
Innovative, Unique, and Powerful:
This is the world’s first RSI Forecast to apply this predictive approach using least squares linear regression. A truly elite-level tool designed for traders who want a real edge in the market.
⯁ SCIENTIFIC BASIS LINEAR REGRESSION
Linear Regression is a fundamental method of statistics and machine learning, used to model the relationship between a dependent variable y and one or more independent variables 𝑥.
The general formula for a simple linear regression is given by:
y = β₀ + β₁x + ε
Where:
y = is the predicted variable (e.g. future value of RSI)
x = is the explanatory variable (e.g. time or bar index)
β0 = is the intercept (value of 𝑦 when 𝑥 = 0)
𝛽1 = is the slope of the line (rate of change)
ε = is the random error term
The goal is to estimate the coefficients 𝛽0 and 𝛽1 so as to minimize the sum of the squared errors — the so-called Random Error Method Least Squares.
⯁ LEAST SQUARES ESTIMATION
To minimize the error between predicted and observed values, we use the following formulas:
β₁ = /
β₀ = ȳ - β₁x̄
Where:
∑ = sum
x̄ = mean of x
ȳ = mean of y
x_i, y_i = individual values of the variables.
Where:
x_i and y_i are the means of the independent and dependent variables, respectively.
i ranges from 1 to n, the number of observations.
These equations guarantee the best linear unbiased estimator, according to the Gauss-Markov theorem, assuming homoscedasticity and linearity.
⯁ LINEAR REGRESSION IN MACHINE LEARNING
Linear regression is one of the cornerstones of supervised learning. Its simplicity and ability to generate accurate quantitative predictions make it essential in AI systems, predictive algorithms, time series analysis, and automated trading strategies.
By applying this model to the RSI, you are literally putting artificial intelligence at the heart of a classic indicator, bringing a new dimension to technical analysis.
⯁ VISUAL INTERPRETATION
Imagine an RSI time series like this:
Time →
RSI →
The regression line will smooth these values and extend them n periods into the future, creating a predicted trajectory based on the historical moment. This line becomes the predicted RSI, which can be crossed with the actual RSI to generate more intelligent signals.
⯁ SUMMARY OF SCIENTIFIC CONCEPTS USED
Linear Regression Models the relationship between variables using a straight line.
Least Squares Minimizes the sum of squared errors between prediction and reality.
Time Series Forecasting Estimates future values based on historical data.
Supervised Learning Trains models to predict outputs from known inputs.
Statistical Smoothing Reduces noise and reveals underlying trends.
⯁ WHY THIS INDICATOR IS REVOLUTIONARY
Scientifically-based: Based on statistical theory and mathematical inference.
Unprecedented: First public RSI with least squares predictive modeling.
Intelligent: Built with machine learning logic.
Practical: Generates forward-thinking signals.
Customizable: Flexible for any trading strategy.
⯁ CONCLUSION
By combining RSI with linear regression, this indicator allows a trader to predict market momentum, not just follow it.
RSI Forecast is not just an indicator — it is a scientific breakthrough in technical analysis technology.
⯁ Example of simple linear regression, which has one independent variable:
⯁ In linear regression, observations ( red ) are considered to be the result of random deviations ( green ) from an underlying relationship ( blue ) between a dependent variable ( y ) and an independent variable ( x ).
⯁ Visualizing heteroscedasticity in a scatterplot against 100 random fitted values using Matlab:
⯁ The data sets in the Anscombe's quartet are designed to have approximately the same linear regression line (as well as nearly identical means, standard deviations, and correlations) but are graphically very different. This illustrates the pitfalls of relying solely on a fitted model to understand the relationship between variables.
⯁ The result of fitting a set of data points with a quadratic function:
_______________________________________________________________________
🥇 This is the world’s first RSI indicator with: Linear Regression for Forecasting 🥇_______________________________________________________________________
_________________________________________________
🔮 Linear Regression: PineScript Technical Parameters 🔮
_________________________________________________
Forecast Types:
• Flat: Assumes prices will remain the same.
• Linreg: Makes a 'Linear Regression' forecast for n periods.
Technical Information:
ta.linreg (built-in function)
Linear regression curve. A line that best fits the specified prices over a user-defined time period. It is calculated using the least squares method. The result of this function is calculated using the formula: linreg = intercept + slope * (length - 1 - offset), where intercept and slope are the values calculated using the least squares method on the source series.
Syntax:
• Function: ta.linreg()
Parameters:
• source: Source price series.
• length: Number of bars (period).
• offset: Offset.
• return: Linear regression curve.
This function has been cleverly applied to the RSI, making it capable of projecting future values based on past statistical trends.
______________________________________________________
______________________________________________________
⯁ WHAT IS THE RSI❓
The Relative Strength Index (RSI) is a technical analysis indicator developed by J. Welles Wilder. It measures the magnitude of recent price movements to evaluate overbought or oversold conditions in a market. The RSI is an oscillator that ranges from 0 to 100 and is commonly used to identify potential reversal points, as well as the strength of a trend.
⯁ HOW TO USE THE RSI❓
The RSI is calculated based on average gains and losses over a specified period (usually 14 periods). It is plotted on a scale from 0 to 100 and includes three main zones:
• Overbought: When the RSI is above 70, indicating that the asset may be overbought.
• Oversold: When the RSI is below 30, indicating that the asset may be oversold.
• Neutral Zone: Between 30 and 70, where there is no clear signal of overbought or oversold conditions.
______________________________________________________
______________________________________________________
⯁ ENTRY CONDITIONS
The conditions below are fully flexible and allow for complete customization of the signal.
______________________________________________________
______________________________________________________
🔹 CONDITIONS TO BUY 📈
______________________________________________________
• Signal Validity: The signal will remain valid for X bars .
• Signal Sequence: Configurable as AND or OR .
📈 RSI Conditions:
🔹 RSI > Upper
🔹 RSI < Upper
🔹 RSI > Lower
🔹 RSI < Lower
🔹 RSI > Middle
🔹 RSI < Middle
🔹 RSI > MA
🔹 RSI < MA
📈 MA Conditions:
🔹 MA > Upper
🔹 MA < Upper
🔹 MA > Lower
🔹 MA < Lower
📈 Crossovers:
🔹 RSI (Crossover) Upper
🔹 RSI (Crossunder) Upper
🔹 RSI (Crossover) Lower
🔹 RSI (Crossunder) Lower
🔹 RSI (Crossover) Middle
🔹 RSI (Crossunder) Middle
🔹 RSI (Crossover) MA
🔹 RSI (Crossunder) MA
🔹 MA (Crossover) Upper
🔹 MA (Crossunder) Upper
🔹 MA (Crossover) Lower
🔹 MA (Crossunder) Lower
📈 RSI Divergences:
🔹 RSI Divergence Bull
🔹 RSI Divergence Bear
📈 RSI Forecast:
🔮 RSI (Crossover) MA Forecast
🔮 RSI (Crossunder) MA Forecast
______________________________________________________
______________________________________________________
🔸 CONDITIONS TO SELL 📉
______________________________________________________
• Signal Validity: The signal will remain valid for X bars .
• Signal Sequence: Configurable as AND or OR .
📉 RSI Conditions:
🔸 RSI > Upper
🔸 RSI < Upper
🔸 RSI > Lower
🔸 RSI < Lower
🔸 RSI > Middle
🔸 RSI < Middle
🔸 RSI > MA
🔸 RSI < MA
📉 MA Conditions:
🔸 MA > Upper
🔸 MA < Upper
🔸 MA > Lower
🔸 MA < Lower
📉 Crossovers:
🔸 RSI (Crossover) Upper
🔸 RSI (Crossunder) Upper
🔸 RSI (Crossover) Lower
🔸 RSI (Crossunder) Lower
🔸 RSI (Crossover) Middle
🔸 RSI (Crossunder) Middle
🔸 RSI (Crossover) MA
🔸 RSI (Crossunder) MA
🔸 MA (Crossover) Upper
🔸 MA (Crossunder) Upper
🔸 MA (Crossover) Lower
🔸 MA (Crossunder) Lower
📉 RSI Divergences:
🔸 RSI Divergence Bull
🔸 RSI Divergence Bear
📉 RSI Forecast:
🔮 RSI (Crossover) MA Forecast
🔮 RSI (Crossunder) MA Forecast
______________________________________________________
______________________________________________________
🤖 AUTOMATION 🤖
• You can automate the BUY and SELL signals of this indicator.
______________________________________________________
______________________________________________________
⯁ UNIQUE FEATURES
______________________________________________________
Linear Regression: (Forecast)
Signal Validity: The signal will remain valid for X bars
Signal Sequence: Configurable as AND/OR
Condition Table: BUY/SELL
Condition Labels: BUY/SELL
Plot Labels in the Graph Above: BUY/SELL
Automate and Monitor Signals/Alerts: BUY/SELL
Linear Regression (Forecast)
Signal Validity: The signal will remain valid for X bars
Signal Sequence: Configurable as AND/OR
Condition Table: BUY/SELL
Condition Labels: BUY/SELL
Plot Labels in the Graph Above: BUY/SELL
Automate and Monitor Signals/Alerts: BUY/SELL
______________________________________________________
📜 SCRIPT : RSI Forecast
🎴 Art by : @Titans_Invest & @DiFlip
👨💻 Dev by : @Titans_Invest & @DiFlip
🎑 Titans Invest — The Wizards Without Gloves 🧤
✨ Enjoy!
______________________________________________________
o Mission 🗺
• Inspire Traders to manifest Magic in the Market.
o Vision 𐓏
• To elevate collective Energy 𐓷𐓏

RSI Full [Titans_Invest]RSI Full
One of the most complete RSI indicators on the market.
While maintaining the classic RSI foundation, our indicator integrates multiple entry conditions to generate more accurate buy and sell signals.
All conditions are fully configurable, allowing complete customization to fit your trading strategy.
⯁ WHAT IS THE RSI❓
The Relative Strength Index (RSI) is a technical analysis indicator developed by J. Welles Wilder. It measures the magnitude of recent price movements to evaluate overbought or oversold conditions in a market. The RSI is an oscillator that ranges from 0 to 100 and is commonly used to identify potential reversal points, as well as the strength of a trend.
⯁ HOW TO USE THE RSI❓
The RSI is calculated based on average gains and losses over a specified period (usually 14 periods). It is plotted on a scale from 0 to 100 and includes three main zones:
Overbought: When the RSI is above 70, indicating that the asset may be overbought.
Oversold: When the RSI is below 30, indicating that the asset may be oversold.
Neutral Zone: Between 30 and 70, where there is no clear signal of overbought or oversold conditions.
⯁ ENTRY CONDITIONS
The conditions below are fully flexible and allow for complete customization of the signal.
______________________________________________________
🔹 CONDITIONS TO BUY 📈
______________________________________________________
• Signal Validity: The signal will remain valid for X bars .
• Signal Sequence: Configurable as AND/OR .
📈 RSI Conditions:
🔹 RSI > Upper
🔹 RSI < Upper
🔹 RSI > Lower
🔹 RSI < Lower
🔹 RSI > Middle
🔹 RSI < Middle
🔹 RSI > MA
🔹 RSI < MA
📈 MA Conditions:
🔹 MA > Upper
🔹 MA < Upper
🔹 MA > Lower
🔹 MA < Lower
📈 Crossovers:
🔹 RSI (Crossover) Upper
🔹 RSI (Crossunder) Upper
🔹 RSI (Crossover) Lower
🔹 RSI (Crossunder) Lower
🔹 RSI (Crossover) Middle
🔹 RSI (Crossunder) Middle
🔹 RSI (Crossover) MA
🔹 RSI (Crossunder) MA
🔹 MA (Crossover) Upper
🔹 MA (Crossunder) Upper
🔹 MA (Crossover) Lower
🔹 MA (Crossunder) Lower
📈 RSI Divergences:
🔹 RSI Divergence Bull
🔹 RSI Divergence Bear
______________________________________________________
______________________________________________________
🔸 CONDITIONS TO SELL 📉
______________________________________________________
• Signal Validity: The signal will remain valid for X bars .
• Signal Sequence: Configurable as AND/OR .
📉 RSI Conditions:
🔸 RSI > Upper
🔸 RSI < Upper
🔸 RSI > Lower
🔸 RSI < Lower
🔸 RSI > Middle
🔸 RSI < Middle
🔸 RSI > MA
🔸 RSI < MA
📉 MA Conditions:
🔸 MA > Upper
🔸 MA < Upper
🔸 MA > Lower
🔸 MA < Lower
📉 Crossovers:
🔸 RSI (Crossover) Upper
🔸 RSI (Crossunder) Upper
🔸 RSI (Crossover) Lower
🔸 RSI (Crossunder) Lower
🔸 RSI (Crossover) Middle
🔸 RSI (Crossunder) Middle
🔸 RSI (Crossover) MA
🔸 RSI (Crossunder) MA
🔸 MA (Crossover) Upper
🔸 MA (Crossunder) Upper
🔸 MA (Crossover) Lower
🔸 MA (Crossunder) Lower
📉 RSI Divergences:
🔸 RSI Divergence Bull
🔸 RSI Divergence Bear
______________________________________________________
______________________________________________________
🤖 AUTOMATION 🤖
• You can automate the BUY and SELL signals of this indicator.
______________________________________________________
______________________________________________________
⯁ UNIQUE FEATURES
______________________________________________________
Signal Validity: The signal will remain valid for X bars
Signal Sequence: Configurable as AND/OR
Condition Table: BUY/SELL
Condition Labels: BUY/SELL
Plot Labels in the Graph Above: BUY/SELL
Automate and Monitor Signals/Alerts: BUY/SELL
Signal Validity: The signal will remain valid for X bars
Signal Sequence: Configurable as AND/OR
Condition Table: BUY/SELL
Condition Labels: BUY/SELL
Plot Labels in the Graph Above: BUY/SELL
Automate and Monitor Signals/Alerts: BUY/SELL
______________________________________________________
📜 SCRIPT : RSI Full
🎴 Art by : @Titans_Invest & @DiFlip
👨💻 Dev by : @Titans_Invest & @DiFlip
🎑 Titans Invest — The Wizards Without Gloves 🧤
✨ Enjoy the Spell!
______________________________________________________
o Mission 🗺
• Inspire Traders to manifest Magic in the Market.
o Vision 𐓏
• To elevate collective Energy 𐓷𐓏

Stochastic Order Flow Momentum [ScorsoneEnterprises]This indicator implements a stochastic model of order flow using the Ornstein-Uhlenbeck (OU) process, combined with a Kalman filter to smooth momentum signals. It is designed to capture the dynamic momentum of volume delta, representing the net buying or selling pressure per bar, and highlight potential shifts in market direction. The volume delta data is sourced from TradingView’s built-in functionality:
www.tradingview.com
For a deeper dive into stochastic processes like the Ornstein-Uhlenbeck model in financial contexts, see these research articles: arxiv.org and arxiv.org
The SOFM tool aims to reveal the momentum and acceleration of order flow, modeled as a mean-reverting stochastic process. In markets, order flow often oscillates around a baseline, with bursts of buying or selling pressure that eventually fade—similar to how physical systems return to equilibrium. The OU process captures this behavior, while the Kalman filter refines the signal by filtering noise. Parameters theta (mean reversion rate), mu (mean level), and sigma (volatility) are estimated by minimizing a squared-error objective function using gradient descent, ensuring adaptability to real-time market conditions.
How It Works
The script combines a stochastic model with signal processing. Here’s a breakdown of the key components, including the OU equation and supporting functions.
// Ornstein-Uhlenbeck model for volume delta
ou_model(params, v_t, lkb) =>
theta = clamp(array.get(params, 0), 0.01, 1.0)
mu = clamp(array.get(params, 1), -100.0, 100.0)
sigma = clamp(array.get(params, 2), 0.01, 100.0)
error = 0.0
v_pred = array.new(lkb, 0.0)
array.set(v_pred, 0, array.get(v_t, 0))
for i = 1 to lkb - 1
v_prev = array.get(v_pred, i - 1)
v_curr = array.get(v_t, i)
// Discretized OU: v_t = v_{t-1} + theta * (mu - v_{t-1}) + sigma * noise
v_next = v_prev + theta * (mu - v_prev)
array.set(v_pred, i, v_next)
v_curr_clean = na(v_curr) ? 0 : v_curr
v_pred_clean = na(v_next) ? 0 : v_next
error := error + math.pow(v_curr_clean - v_pred_clean, 2)
error
The ou_model function implements a discretized Ornstein-Uhlenbeck process:
v_t = v_{t-1} + theta (mu - v_{t-1})
The model predicts volume delta (v_t) based on its previous value, adjusted by the mean-reverting term theta (mu - v_{t-1}), with sigma representing the volatility of random shocks (approximated in the Kalman filter).
Parameters Explained
The parameters theta, mu, and sigma represent distinct aspects of order flow dynamics:
Theta:
Definition: The mean reversion rate, controlling how quickly volume delta returns to its mean (mu). Constrained between 0.01 and 1.0 (e.g., clamp(array.get(params, 0), 0.01, 1.0)).
Interpretation: A higher theta indicates faster reversion (short-lived momentum), while a lower theta suggests persistent trends. Initial value is 0.1 in init_params.
In the Code: In ou_model, theta scales the pull toward \mu, influencing the predicted v_t.
Mu:
Definition: The long-term mean of volume delta, representing the equilibrium level of net buying/selling pressure. Constrained between -100.0 and 100.0 (e.g., clamp(array.get(params, 1), -100.0, 100.0)).
Interpretation: A positive mu suggests a bullish bias, while a negative mu indicates bearish pressure. Initial value is 0.0 in init_params.
In the Code: In ou_model, mu is the target level that v_t reverts to over time.
Sigma:
Definition: The volatility of volume delta, capturing the magnitude of random fluctuations. Constrained between 0.01 and 100.0 (e.g., clamp(array.get(params, 2), 0.01, 100.0)).
Interpretation: A higher sigma reflects choppier, noisier order flow, while a lower sigma indicates smoother behavior. Initial value is 0.1 in init_params.
In the Code: In the Kalman filter, sigma contributes to the error term, adjusting the smoothing process.
Summary:
theta: Speed of mean reversion (how fast momentum fades).
mu: Baseline order flow level (bullish or bearish bias).
sigma: Noise level (variability in order flow).
Other Parts of the Script
Clamp
A utility function to constrain parameters, preventing extreme values that could destabilize the model.
ObjectiveFunc
Defines the objective function (sum of squared errors) to minimize during parameter optimization. It compares the OU model’s predicted volume delta to observed data, returning a float to be minimized.
How It Works: Calls ou_model to generate predictions, computes the squared error for each timestep, and sums it. Used in optimization to assess parameter fit.
FiniteDifferenceGradient
Calculates the gradient of the objective function using finite differences. Think of it as finding the "slope" of the error surface for each parameter. It nudges each parameter (theta, mu, sigma) by a small amount (epsilon) and measures the change in error, returning an array of gradients.
Minimize
Performs gradient descent to optimize parameters. It iteratively adjusts theta, mu, and sigma by stepping down the "hill" of the error surface, using the gradients from FiniteDifferenceGradient. Stops when the gradient norm falls below a tolerance (0.001) or after 20 iterations.
Kalman Filter
Smooths the OU-modeled volume delta to extract momentum. It uses the optimized theta, mu, and sigma to predict the next state, then corrects it with observed data via the Kalman gain. The result is a cleaner momentum signal.
Applied
After initializing parameters (theta = 0.1, mu = 0.0, sigma = 0.1), the script optimizes them using volume delta data over the lookback period. The optimized parameters feed into the Kalman filter, producing a smoothed momentum array. The average momentum and its rate of change (acceleration) are calculated, though only momentum is plotted by default.
A rising momentum suggests increasing buying or selling pressure, while a flattening or reversing momentum indicates fading activity. Acceleration (not plotted here) could highlight rapid shifts.
Tool Examples
The SOFM indicator provides a dynamic view of order flow momentum, useful for spotting directional shifts or consolidation.
Low Time Frame Example: On a 5-minute chart of SEED_ALEXDRAYM_SHORTINTEREST2:NQ , a rising momentum above zero with a lookback of 5 might signal building buying pressure, while a drop below zero suggests selling dominance. Crossings of the zero line can mark transitions, though the focus is on trend strength rather than frequent crossovers.
High Time Frame Example: On a daily chart of NYSE:VST , a sustained positive momentum could confirm a bullish trend, while a sharp decline might warn of exhaustion. The mean-reverting nature of the OU process helps filter out noise on longer scales. It doesn’t make the most sense to use this on a high timeframe with what our data is.
Choppy Markets: When momentum oscillates near zero, it signals indecision or low conviction, helping traders avoid whipsaws. Larger deviations from zero suggest stronger directional moves to act on, this is on $STT.
Inputs
Lookback: Users can set the lookback period (default 5) to adjust the sensitivity of the OU model and Kalman filter. Shorter lookbacks react faster but may be noisier; longer lookbacks smooth more but lag slightly.
The user can also specify the timeframe they want the volume delta from. There is a default way to lower and expand the time frame based on the one we are looking at, but users have the flexibility.
No indicator is 100% accurate, and SOFM is no exception. It’s an estimation tool, blending stochastic modeling with signal processing to provide a leading view of order flow momentum. Use it alongside price action, support/resistance, and your own discretion for best results. I encourage comments and constructive criticism.

Body Percentage of Range (Colored)Short Description:
This indicator measures the dominance of the candle's body relative to its total range (High - Low), providing a visual gauge of intra-candle strength versus indecision. Columns are colored based on whether the body constitutes more or less than a defined percentage (default 50%) of the candle's total height.
Detailed Description:
What it Does:
The "Body Percentage of Range" indicator calculates, for each candle, what percentage of the total price range (High minus Low) is occupied by the candle's body (absolute difference between Open and Close).
A value of 100% means the candle has no wicks (a Marubozu), indicating strong conviction during that period.
A value of 0% means the candle has no body (a Doji), indicating perfect indecision.
Values in between show the relative balance between the directional move (body) and the price exploration/rejection (wicks).
How to Interpret:
The indicator plots this percentage as columns:
Column Height: Represents the percentage of the body relative to the total range. Higher columns indicate a larger body dominance.
Column Color:
Green Columns: Appear when the body percentage is above the user-defined threshold (default 50%). This suggests that the directional move within the candle was stronger than the indecision (wicks). Often seen during trending moves or strong momentum candles.
Red Columns: Appear when the body percentage is at or below the user-defined threshold (default 50%). This suggests that wicks dominate the candle (body is 50% or less of the range), indicating significant indecision, struggle between buyers and sellers, or potential reversals. These are common in choppy, consolidating, or reversal market conditions.
Orange Line (Optional MA): A Simple Moving Average (SMA) of the body percentages is plotted to help smooth the readings and identify broader periods where candle structure indicates more trending (high MA) vs. ranging/indecisive (low MA) characteristics.
Potential Use Cases:
Identifying Choppy vs. Trending Markets: Sustained periods of low, predominantly red columns (and often a low/declining MA) can signal a choppy, range-bound market where trend-following strategies might underperform. Conversely, periods with frequent high, green columns suggest a more trending environment.
Confirming Breakouts/Momentum: High green columns appearing alongside increased volume during a breakout can add conviction to the move's strength.
Spotting Potential Exhaustion/Reversals: A very tall green column after a strong trend, followed immediately by a low red column (like a Doji or Spinning Top pattern appearing on the price chart), might signal potential exhaustion or a pending reversal, indicating indecision has suddenly entered the market.
Filtering Entries: Traders might avoid taking entries (especially trend-following ones) when the indicator shows a consistent pattern of low red columns, suggesting high market indecision.
Settings:
Color Threshold %: Allows you to set the percentage level above which columns turn green (default is 50%).
Smoothing MA Length: Adjusts the lookback period for the Simple Moving Average.
Disclaimer:
This indicator is a tool for technical analysis and should be used in conjunction with other methods (like price action, volume analysis, other indicators) and robust risk management. It does not provide direct buy/sell signals and past performance is not indicative of future results.

Customizable RSI/StochRSI Double ConfirmationBelow are the key adjustable parameters in the script and their usage:
RSI Parameters
RSI Length: The number of periods used to calculate the RSI, with a default value of 7. Adjusting this parameter changes the sensitivity of the RSI—shorter periods make it more sensitive, while longer periods make it smoother.
RSI Source: The price source used for RSI calculation, defaulting to the closing price (close). This can be changed to the opening price or other price types as needed.
StochRSI Parameters
StochRSI Length: The number of periods used to calculate the StochRSI, with a default value of 5. This affects how quickly the StochRSI reacts to changes in the RSI.
StochRSI Smooth K: The smoothing period for the StochRSI %K line, with a default value of 3. This is used to reduce noise.
StochRSI Smooth D: The smoothing period for the StochRSI %D line, with a default value of 3. It works in conjunction with %K to provide more stable signals.
Signal Thresholds
RSI Buy Threshold: A buy signal is triggered when the RSI crosses above this value (default 20).
RSI Sell Threshold: A sell signal is triggered when the RSI crosses below this value (default 80).
StochRSI Buy Threshold: A buy signal is triggered when the StochRSI %K crosses above this value (default 20).
StochRSI Sell Threshold: A sell signal is triggered when the StochRSI %K crosses below this value (default 80).
Signals
RSI Buy/Sell Signals: When the RSI crosses the buy/sell threshold, a green "RSI Buy" or red "RSI Sell" is displayed on the chart.
StochRSI Buy/Sell Signals: When the StochRSI %K crosses the buy/sell threshold, a yellow "StochRSI Buy" or purple "StochRSI Sell" is displayed.
Double Buy/Sell Signals: When both RSI and StochRSI simultaneously trigger buy/sell signals, a green "Double Buy" or red "Double Sell" is displayed, indicating a stronger trading opportunity.
The volatility of different cryptocurrencies varies, and different parameters may be suitable for each. Users need to experiment and select the most appropriate parameters themselves.
Disclaimer: This script is for informational purposes only and should not be considered financial advice; use it at your own risk.

CVD Divergence Insights📘 CVD Divergence Insights – by Colicoid
Pine Script v6 | Volume Delta Divergence Oscillator with Spike Detection
⸻
🔍 Overview
CVD Divergence Insights is a volume-aware oscillator and divergence spike detector that helps you spot smart money activity, absorption, failed pressure, and hidden strength or weakness — even when price action alone gives little away.
It works by comparing normalized Cumulative Volume Delta (CVD) against normalized price movement, and optionally applying a volume-weighting layer to highlight when aggressive participation is truly behind the divergence. The result is a dynamic visual tool that identifies tension in the market, and helps you trade based on how that tension resolves.
⸻
🧠 Core Concept
• When price moves one way and CVD moves another, it reflects imbalance between aggression and result.
• Divergence is not a trigger — it’s a build-up of pressure.
• The real edge lies in the resolution of that pressure.
• Optional volume-weighting helps you ignore noise and focus on high-conviction moves only.
⸻
⚙️ How It Works
1. CVD Calculation
CVD is generated using lower-timeframe delta volume (buy vs. sell pressure), accumulated per bar.
2. Oscillator
A normalized divergence between the smoothed CVD and smoothed price.
3. Volume Weighting (optional)
Emphasizes divergences occurring on higher-than-normal volume, deprioritizes low-volume noise.
4. Signal Line (optional)
A short EMA of the oscillator to help track momentum shifts (hidden by default).
5. Divergence Spikes
Statistical spike detection using standard deviation — green/red dots highlight unusually large divergence activity.
⸻
🎛️ Inputs
Anchor Period
Higher timeframe where the CVD is accumulated and processed.
Lower Timeframe
Optional override for granularity of buy/sell volume data.
SMA Length
Used for smoothing both price and CVD before divergence is calculated.
Volume Weighted?
Enables adaptive weighting based on relative volume size.
Volume Normalization Length
Lookback period used to define what is “normal” volume.
Divergence Spike Threshold
StdDev-based threshold to detect abnormally large divergences.
Signal Line Length
Controls the EMA smoothing of the optional signal line (hidden by default).
⸻
📈 Trade Setup Example: Hidden Bullish Divergence
1. Price forms a higher low, but CVD forms a lower low — hidden bullish divergence.
2. This shows aggressive sellers are trying, but price is resilient — likely absorption.
3. You wait for a "convergent signal bar":
• A bullish candle with strong structure or body
• Confirmed by CVD starting to turn upward
4. That’s your trigger bar — the tension resolves upward.
⸻
🤝 Recommended Pairings
For best results, combine CVD Divergence Insights with the companion script:
🔗 Cumulative Volume Delta Line (also by Colicoid)
This lets you:
• See the raw CVD line and its SMA visually
• Spot standard and hidden divergences in price/CVD directly
• Use the Insights indicator to evaluate divergence quality and flag aggressive bull/bear behavior
• Use the same SMA length on both indicators for alignment
👉 Tip: To save screen space, drag the CVD Line indicator into the same panel as CVD Divergence Insights.
⸻
🧰 Why Use This?
• ✅ Catch absorption setups and failed pressure zones
• ✅ Filter out low-quality divergences using volume context
• ✅ Understand why price is hesitating or breaking out
• ✅ Add smart confirmation to breakout/reversal trades
• ✅ Align your execution with who’s actually in control
⸻
📎 Created by Colicoid
Built in Pine Script v6 for advanced price-volume analysis, with focus on effort vs result, market psychology, and smart money detection.

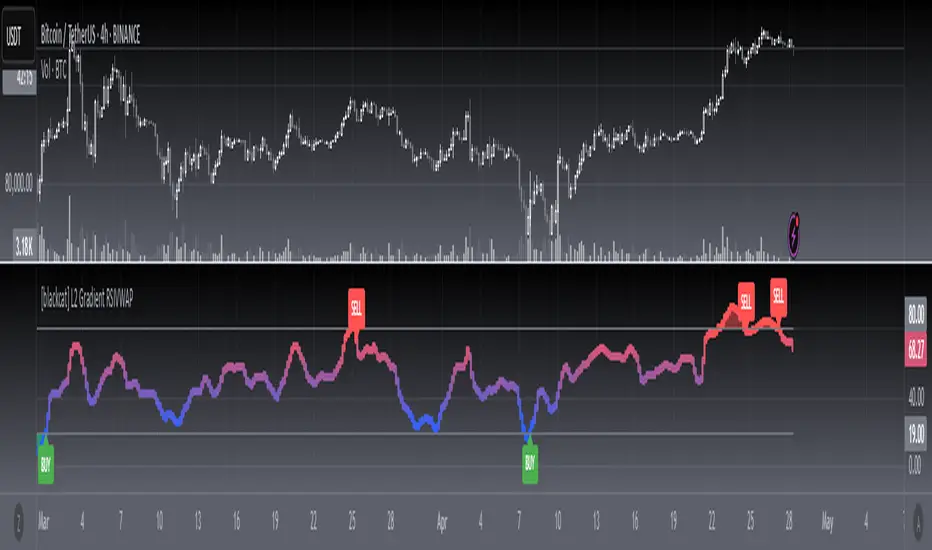
[blackcat] L2 Gradient RSIVWAPOVERVIEW
The L2 Gradient RSIVWAP indicator offers traders a powerful tool for assessing market conditions by combining Relative Strength Index (RSI) with Volume Weighted Average Price (VWAP). It features dynamic coloring and clear buy/sell signals to enhance decision-making.
Customizable Inputs: Adjust key parameters such as RSI-VWAP length, oversold/overbought levels, and smoothing period.
Gradient Color Visualization: Provides intuitive gradient coloring to represent RSI-VWAP values.
Buy/Sell Indicators: On-chart labels highlight potential buying and selling opportunities.
Transparent Fills: Visually distinguishes overbought and oversold zones without obscuring other data.
Access the TradingView platform and select the chart where you wish to implement the indicator.
Go to “Indicators” in the toolbar and search for “ L2 Gradient RSIVWAP.”
Click “Add to Chart” to integrate the indicator into your chart.
Customize settings via the input options:
Toggle between standard RSI and RSI-based VWAP.
Set preferred lengths and thresholds for RSI-VWAP calculations.
Configure the smoothing period for ALMA.
Performance can vary based on asset characteristics like liquidity and volatility.
Historical backtests do not predict future market behavior accurately.
The ALMA function, developed by Arnaud Legoux, enhances response times relative to simple moving averages.
Buy and sell signals are derived from RSI-VWAP crossovers; consider additional factors before making trades.
Special thanks to Arnaud Legoux for creating the ALMA function.
Composite Reversal IndicatorOverview
The "Composite Reversal Indicator" aggregates five technical signals to produce a composite score that ranges from -5 (strongly bearish) to +5 (strongly bullish). These signals come from:
Relative Strength Index (RSI)
Moving Average Convergence Divergence (MACD)
Accumulation/Distribution (A/D)
Volume relative to its moving average
Price proximity to support and resistance levels
Each signal contributes a value of +1 (bullish), -1 (bearish), or 0 (neutral) to the total score. The raw score is plotted as a histogram, and a smoothed version is plotted as a colored line to highlight trends.
Step-by-Step Explanation
1. Customizable Inputs
The indicator starts with user-defined inputs that allow traders to tweak its settings. These inputs include:
RSI: Length (e.g., 14), oversold level (e.g., 30), and overbought level (e.g., 70).
MACD: Fast length (e.g., 12), slow length (e.g., 26), and signal length (e.g., 9).
Volume: Moving average length (e.g., 20) and multipliers for high (e.g., 1.5) and low (e.g., 0.5) volume thresholds.
Price Levels: Period for support and resistance (e.g., 50) and proximity percentage (e.g., 2%).
Score Smoothing: Length for smoothing the score (e.g., 5).
These inputs make the indicator adaptable to different trading styles, assets, or timeframes.
2. Indicator Calculations
The script calculates five key indicators using the input parameters:
RSI: Measures momentum and identifies overbought or oversold conditions.
Formula: rsi = ta.rsi(close, rsi_length)
Example: With a length of 14, it analyzes the past 14 bars of closing prices.
MACD: Tracks trend and momentum using two exponential moving averages (EMAs).
Formula: = ta.macd(close, macd_fast, macd_slow, macd_signal)
Components: MACD line (fast EMA - slow EMA), signal line (EMA of MACD line).
Accumulation/Distribution (A/D): A volume-based indicator showing buying or selling pressure.
Formula: ad = ta.accdist
Reflects cumulative flow based on price and volume.
Volume Moving Average: A simple moving average (SMA) of trading volume.
Formula: vol_ma = ta.sma(volume, vol_ma_length)
Example: A 20-bar SMA smooths volume data.
Support and Resistance Levels: Key price levels based on historical lows and highs.
Formulas:
support = ta.lowest(low, price_level_period)
resistance = ta.highest(high, price_level_period)
Example: Over 50 bars, it finds the lowest low and highest high.
These calculations provide the raw data for generating signals.
3. Signal Generation
Each indicator produces a signal based on specific conditions:
RSI Signal:
+1: RSI < oversold level (e.g., < 30) → potential bullish reversal.
-1: RSI > overbought level (e.g., > 70) → potential bearish reversal.
0: Otherwise.
Logic: Extreme RSI values suggest price may reverse.
MACD Signal:
+1: MACD line > signal line → bullish momentum.
-1: MACD line < signal line → bearish momentum.
0: Equal.
Logic: Crossovers indicate trend shifts.
A/D Signal:
+1: Current A/D > previous A/D → accumulation (bullish).
-1: Current A/D < previous A/D → distribution (bearish).
0: Unchanged.
Logic: Rising A/D shows buying pressure.
Volume Signal:
+1: Volume > high threshold (e.g., 1.5 × volume MA) → strong activity (bullish).
-1: Volume < low threshold (e.g., 0.5 × volume MA) → weak activity (bearish).
0: Otherwise.
Logic: Volume spikes often confirm reversals.
Price Signal:
+1: Close near support (within proximity %, e.g., 2%) → potential bounce.
-1: Close near resistance (within proximity %) → potential rejection.
0: Otherwise.
Logic: Price near key levels signals reversal zones.
4. Composite Score
The raw composite score is the sum of the five signals:
Formula: score = rsi_signal + macd_signal + ad_signal + vol_signal + price_signal
Range: -5 (all signals bearish) to +5 (all signals bullish).
Purpose: Combines multiple perspectives into one number.
5. Smoothed Score
A smoothed version of the score reduces noise:
Formula: score_ma = ta.sma(score, score_ma_length)
Example: With a length of 5, it averages the score over 5 bars.
Purpose: Highlights the trend rather than short-term fluctuations.
6. Visualization
The indicator plots two elements:
Raw Score: A gray histogram showing the composite score per bar.
Style: plot.style_histogram
Color: Gray.
Smoothed Score: A line that changes color:
Green: Score > 0 (bullish).
Red: Score < 0 (bearish).
Gray: Score = 0 (neutral).
Style: plot.style_line, thicker line (e.g., linewidth=2).
These visuals make it easy to spot potential reversals.
How It Works Together
The indicator combines signals from:
RSI: Momentum extremes.
MACD: Trend shifts.
A/D: Buying/selling pressure.
Volume: Confirmation of moves.
Price Levels: Key reversal zones.
By summing these into a composite score, it filters out noise and provides a unified signal. A high positive score (e.g., +3 to +5) suggests a bullish reversal, while a low negative score (e.g., -3 to -5) suggests a bearish reversal. The smoothed score helps traders focus on the trend.
Practical Use
Bullish Reversal: Smoothed score is green and rising → look for buying opportunities.
Bearish Reversal: Smoothed score is red and falling → consider selling or shorting.
Neutral: Score near 0 → wait for clearer signals.
Traders can adjust inputs to suit their strategy, making it versatile for stocks, forex, or crypto.

Mogwai Method with RSI and EMA - BTCUSD 15mThis is a custom TradingView indicator designed for trading Bitcoin (BTCUSD) on a 15-minute timeframe. It’s based on the Mogwai Method—a mean-reversion strategy—enhanced with the Relative Strength Index (RSI) for momentum confirmation. The indicator generates buy and sell signals, visualized as green and red triangle arrows on the chart, to help identify potential entry and exit points in the volatile cryptocurrency market.
Components
Bollinger Bands (BB):
Purpose: Identifies overextended price movements, signaling potential reversions to the mean.
Parameters:
Length: 20 periods (standard for mean-reversion).
Multiplier: 2.2 (slightly wider than the default 2.0 to suit BTCUSD’s volatility).
Role:
Buy signal when price drops below the lower band (oversold).
Sell signal when price rises above the upper band (overbought).
Relative Strength Index (RSI):
Purpose: Confirms momentum to filter out false signals from Bollinger Bands.
Parameters:
Length: 14 periods (classic setting, effective for crypto).
Overbought Level: 70 (price may be overextended upward).
Oversold Level: 30 (price may be overextended downward).
Role:
Buy signal requires RSI < 30 (oversold).
Sell signal requires RSI > 70 (overbought).
Exponential Moving Averages (EMAs) (Plotted but not currently in signal logic):
Purpose: Provides trend context (included in the script for visualization, optional for signal filtering).
Parameters:
Fast EMA: 9 periods (short-term trend).
Slow EMA: 50 periods (longer-term trend).
Role: Can be re-added to filter signals (e.g., buy only when Fast EMA > Slow EMA).
Signals (Triangles):
Buy Signal: Green upward triangle below the bar when price is below the lower Bollinger Band and RSI is below 30.
Sell Signal: Red downward triangle above the bar when price is above the upper Bollinger Band and RSI is above 70.
How It Works
The indicator combines Bollinger Bands and RSI to spot mean-reversion opportunities:
Buy Condition: Price breaks below the lower Bollinger Band (indicating oversold conditions), and RSI confirms this with a reading below 30.
Sell Condition: Price breaks above the upper Bollinger Band (indicating overbought conditions), and RSI confirms this with a reading above 70.
The strategy assumes that extreme price movements in BTCUSD will often revert to the mean, especially in choppy or ranging markets.
Visual Elements
Green Upward Triangles: Appear below the candlestick to indicate a buy signal.
Red Downward Triangles: Appear above the candlestick to indicate a sell signal.
Bollinger Bands: Gray lines (upper, middle, lower) plotted for reference.
EMAs: Blue (Fast) and Orange (Slow) lines for trend visualization.
How to Use the Indicator
Setup
Open TradingView:
Log into TradingView and select a BTCUSD chart from a supported exchange (e.g., Binance, Coinbase, Bitfinex).
Set Timeframe:
Switch the chart to a 15-minute timeframe (15m).
Add the Indicator:
Open the Pine Editor (bottom panel in TradingView).
Copy and paste the script provided.
Click “Add to Chart” to apply it.
Verify Display:
You should see Bollinger Bands (gray), Fast EMA (blue), Slow EMA (orange), and buy/sell triangles when conditions are met.
Trading Guidelines
Buy Signal (Green Triangle Below Bar):
What It Means: Price is oversold, potentially ready to bounce back toward the Bollinger Band middle line.
Action:
Enter a long position (buy BTCUSD).
Set a take-profit near the middle Bollinger Band (bb_middle) or a resistance level.
Place a stop-loss 1-2% below the entry (or based on ATR, e.g., ta.atr(14) * 2).
Best Context: Works well in ranging markets; avoid during strong downtrends.
Sell Signal (Red Triangle Above Bar):
What It Means: Price is overbought, potentially ready to drop back toward the middle line.
Action:
Enter a short position (sell BTCUSD) or exit a long position.
Set a take-profit near the middle Bollinger Band or a support level.
Place a stop-loss 1-2% above the entry.
Best Context: Effective in ranging markets; avoid during strong uptrends.
Trend Filter (Optional):
To reduce false signals in trending markets, you can modify the script:
Add and ema_fast > ema_slow to the buy condition (only buy in uptrends).
Add and ema_fast < ema_slow to the sell condition (only sell in downtrends).
Check the Fast EMA (blue) vs. Slow EMA (orange) alignment visually.
Tips for BTCUSD on 15-Minute Charts
Volatility: BTCUSD can be erratic. If signals are too frequent, increase bb_mult (e.g., to 2.5) or adjust RSI levels (e.g., 75/25).
Confirmation: Use volume spikes or candlestick patterns (e.g., doji, engulfing) to confirm signals.
Time of Day: Mean-reversion works best during low-volume periods (e.g., Asian session in crypto).
Backtesting: Use TradingView’s Strategy Tester (convert to a strategy by adding entry/exit logic) to evaluate performance with historical BTCUSD data up to March 13, 2025.
Risk Management
Position Size: Risk no more than 1-2% of your account per trade.
Stop Losses: Always use stops to protect against BTCUSD’s sudden moves.
Avoid Overtrading: Wait for clear signals; don’t force trades in choppy or unclear conditions.
Example Scenario
Chart: BTCUSD, 15-minute timeframe.
Buy Signal: Price drops to $58,000, below the lower Bollinger Band, RSI at 28. A green triangle appears.
Action: Buy at $58,000, target $59,000 (middle BB), stop at $57,500.
Sell Signal: Price rises to $60,500, above the upper Bollinger Band, RSI at 72. A red triangle appears.
Action: Sell at $60,500, target $59,500 (middle BB), stop at $61,000.
This indicator is tailored for mean-reversion trading on BTCUSD. Let me know if you’d like to tweak it further (e.g., add filters, alerts, or alternative indicators)!

RSI, Volume, MACD, EMA ComboRSI + Volume + MACD + EMA Trading System
This script combines four powerful indicators—Relative Strength Index (RSI), Volume, Moving Average Convergence Divergence (MACD), and Exponential Moving Average (EMA)—to create a comprehensive trading strategy for better trend confirmation and trade entries.
How It Works
RSI (Relative Strength Index)
Helps identify overbought and oversold conditions.
Used to confirm momentum strength before taking a trade.
Volume
Confirms the strength of price movements.
Avoids false signals by ensuring there is sufficient trading activity.
MACD (Moving Average Convergence Divergence)
Confirms trend direction and momentum shifts.
Provides buy/sell signals through MACD line crossovers.
EMA (Exponential Moving Average)
Acts as a dynamic support and resistance level.
Helps filter out trades that go against the overall trend.
Trading Logic
Buy Signal:
RSI is above 50 (bullish momentum).
MACD shows a bullish crossover.
The price is above the EMA (trend confirmation).
Volume is increasing (strong participation).
Sell Signal:
RSI is below 50 (bearish momentum).
MACD shows a bearish crossover.
The price is below the EMA (downtrend confirmation).
Volume is increasing (intense selling pressure).
Backtesting & Risk Management
The strategy is optimized for scalping on the 1-minute timeframe (adjustable for other timeframes).
Default settings use realistic commission and slippage to simulate actual trading conditions.
A stop-loss and take-profit system is integrated to manage risk effectively.
This script is designed to help traders filter out false signals, improve trend confirmation, and increase trade accuracy by combining multiple indicators in a structured way.

Sniper Trade Pro (ES 15-Min) - Topstep Optimized🔹 Overview
Sniper Trade Pro is an advanced algorithmic trading strategy designed specifically for E-mini S&P 500 (ES) Futures on the 15-minute timeframe. This strategy is optimized for Topstep 50K evaluations, incorporating strict risk management to comply with their max $1,000 daily loss limit while maintaining a high probability of success.
It uses a multi-confirmation approach, integrating:
✅ Money Flow Divergence (MFD) → To track liquidity imbalances and institutional accumulation/distribution.
✅ Trend Confirmation (EMA + VWAP) → To identify strong trend direction and avoid choppy markets.
✅ ADX Strength Filter → To ensure entries only occur in trending conditions, avoiding weak setups.
✅ Break-Even & Dynamic Stop-Losses → To reduce drawdowns and protect profits dynamically.
This script automatically generates Buy and Sell signals and provides built-in risk management for automated trading execution through TradingView Webhooks.
🔹 How Does This Strategy Work?
📌 1. Trend Confirmation (EMA + VWAP)
The strategy uses:
✔ 9-EMA & 21-EMA: Fast-moving averages to detect short-term momentum.
✔ VWAP (Volume-Weighted Average Price): Ensures trades align with institutional volume flow.
How it works:
Bullish Condition: 9-EMA above 21-EMA AND price above VWAP → Confirms buy trend.
Bearish Condition: 9-EMA below 21-EMA AND price below VWAP → Confirms sell trend.
📌 2. Liquidity & Money Flow Divergence (MFD)
This indicator measures liquidity shifts by tracking momentum changes in price and volume.
✔ MFD Calculation:
Uses Exponential Moving Average (EMA) of Momentum (MOM) to detect changes in buying/selling pressure.
If MFD is above its moving average, it signals liquidity inflows → bullish strength.
If MFD is below its moving average, it signals liquidity outflows → bearish weakness.
Why is this important?
Detects when Smart Money is accumulating or distributing before major moves.
Filters out false breakouts by confirming momentum strength before entry.
📌 3. Trade Entry Triggers (Candlestick Patterns & ADX Filter)
To avoid random entries, the strategy waits for specific candlestick confirmations with ADX trend strength:
✔ Bullish Entry (Buy Signal) → Requires:
Bullish Engulfing Candle (Reversal confirmation)
ADX > 20 (Ensures strong trending conditions)
MFD above its moving average (Liquidity inflows)
9-EMA > 21-EMA & price above VWAP (Trend confirmation)
✔ Bearish Entry (Sell Signal) → Requires:
Bearish Engulfing Candle (Reversal confirmation)
ADX > 20 (Ensures strong trending conditions)
MFD below its moving average (Liquidity outflows)
9-EMA < 21-EMA & price below VWAP (Trend confirmation)
📌 4. Risk Management & Profit Protection
This strategy is built with strict risk management to maintain low drawdowns and maximize profits:
✔ Dynamic Position Sizing → Automatically adjusts trade size to risk a fixed $400 per trade.
✔ Adaptive Stop-Losses → Uses ATR-based stop-loss (0.8x ATR) to adapt to market volatility.
✔ Take-Profit Targets → Fixed at 2x ATR for a Risk:Reward ratio of 2:1.
✔ Break-Even Protection → Moves stop-loss to entry once price moves 1x ATR in profit, locking in gains.
✔ Max Daily Loss Limit (-$1,000) → Stops trading if total losses exceed $1,000, complying with Topstep rules.

Shavarie's MCV IndicatorShavarie's MCV Indicator (MACD + CCI + Volume Delta) is a custom-built trend-following and volume-based indicator that helps traders confirm market direction with high accuracy. It combines the MACD (Moving Average Convergence Divergence), CCI (Commodity Channel Index), and Volume Delta, ensuring that all three indicators align before making a trading decision. The goal is to filter out false signals and provide high-probability trade setups.
History & Development
Shavarie's MCV Indicator was developed by Shavarie Gordon, an experienced swing trader, to improve trend confirmation on Gold (XAUUSD) and other markets. After testing various indicators, Shavarie discovered that MACD, CCI, and Volume Delta together provide the best combination of trend strength, momentum, and real-time volume flow. This indicator was designed to eliminate lagging signals, improve win rates, and enhance market timing for both swing and scalping strategies.
How It Works & Calculations
MACD (Moving Average Convergence Divergence)
Measures momentum and trend strength using the difference between a 12-period EMA and a 26-period EMA.
The MACD line and Signal line crossover confirms buy/sell signals.
A rising MACD histogram confirms bullish strength, while a falling histogram confirms bearish strength.
CCI (Commodity Channel Index)
Measures how far the price is from its statistical average.
Above +100 → Overbought (strong trend continuation or reversal).
Below -100 → Oversold (strong trend continuation or reversal).
When CCI aligns with MACD, it confirms momentum strength.
Volume Delta
Measures the difference between buying and selling volume in real time.
A positive delta means more aggressive buying (bullish).
A negative delta means more aggressive selling (bearish).
Helps confirm MACD and CCI trends by showing real volume strength.
Key Takeaways & Features
✅ No false signals: All three indicators must align before entering a trade.
✅ Trend confirmation: Ensures momentum and volume agree before trading.
✅ Works on multiple timeframes: Designed for swing trading on the daily and scalping on 45 min + 5 min.
✅ Great for Gold & Metals: Optimized for XAUUSD, XAUJPY, XAU/AUD, and possibly Palladium (XPDUSD).
✅ Custom-built by a professional trader: Developed by Shavarie Gordon after extensive testing.
Summary
Shavarie’s MCV Indicator is a powerful and reliable trading tool that combines momentum, trend, and volume analysis. By ensuring that MACD, CCI, and Volume Delta align, it eliminates false signals and increases trade accuracy. Whether used for swing trading or scalping, this indicator helps traders enter high-probability trades with confidence.

Delta VolDelta Volume BTC - Multi Pair
Description The Delta Volume BTC - Multi Pair indicator visualizes the balance between buying and selling volume across multiple Bitcoin exchanges. By analyzing price action within each bar, it provides insight into underlying market pressure that traditional volume indicators miss. This indicator allows traders to:
Compare volume flow across Coinbase, Binance, and Binance Perpetual markets
Identify divergences between exchanges that may signal market shifts
Detect accumulation or distribution patterns through volume imbalances
View exchanges individually or in aggregate for comprehensive analysis
Calculation Methods The indicator offers three volume delta calculation methods:
VWAP Based (default):
price_range = high - low
buy_percent = (close - low) / price_range
sell_percent = (high - close) / price_range
delta = volume * (buy_percent - sell_percent)
This method distributes volume based on where price closed within the bar's range, providing a nuanced view of buying/selling pressure.
Tick Based :
delta = volume * sign(hlc3 - previous_hlc3)
This approach assigns volume based on the direction of typical price movement between bars, capturing momentum between periods.
Simple :
delta = close > open ? volume : close < open ? -volume : 0
A straightforward method that assigns positive volume to up bars and negative volume to down bars.
When Aggregate Mode is enabled, the indicator sums the volume deltas from all selected exchanges:
aggregate_delta = coinbase_delta + binance_delta + binance_perp_delta
Features
Multi-Exchange Support : Track volume delta across Coinbase, Binance, and Binance Perpetual futures
Advanced Calculation Methods : Choose between VWAP-based, tick-based, or simple volume delta algorithms
Flexible Display Options : Visualize as histogram, columns, area, or line charts
Customizable Colors : Distinct color schemes for each exchange and direction
Smoothing Options : Apply EMA, SMA, or WMA to reduce noise
Aggregate Mode : Combine all exchanges to see total market flow
How to Use
Individual Exchange Analysis : Uncheck "Aggregate Mode" to see each exchange separately, revealing where smart money may be positioning
Divergence Detection : Watch for one exchange showing buying while others show selling
Volume Trend Confirmation : Strong price moves should be accompanied by strong delta in the same direction
Liquidity Analysis : Compare spot vs futures volume delta to identify market sentiment shifts
The Delta Volume BTC - Multi Pair indicator helps identify the "hidden" buying and selling pressure that may not be apparent from price action alone, giving you an edge in understanding market dynamics across the Bitcoin ecosystem.

LineReg Candles with Hma filterOverview
Purpose:
The indicator creates “LinReg Candles” by recalculating OHLC values using linear regression (to smooth out noise) and overlays additional features such as a customizable signal line and an HMA (Hull Moving Average) filter for trend detection. It also plots buy/sell signals and supports alerts.
Customization:
Users can adjust settings for signal smoothing (choosing SMA, EMA, or WMA), HMA periods (preset for Scalping/Intraday or custom values), linear regression length, colors, display options, and alert messages. Inputs are organized into groups for clarity.
Input Definitions
Signal Settings:
signal_length and smoothingType define the period and method used to smooth the close price, creating a signal line.
HMA Filter Settings:
A dropdown (t_type) lets you choose between Scalping, Intraday, or Custom. Based on this, three HMA periods (hma1, hma2, hma3) are set either to fixed values or user-defined custom inputs.
LinReg Settings:
Users can toggle linear regression for OHLC values (lin_reg) and set its period (linreg_length) to reduce price noise.
Color and Display Settings:
These control the colors for buy/sell candles, default bullish/bearish candles, markers, and background highlighting. Display toggles decide whether to show the background, signal line, HMA filter, and the recalculated candles.
Alert and Plot Customization:
Alerts can be enabled with custom messages. Additionally, line width and transparency for the plotted signal and HMA lines are adjustable.
Function Definitions
calcOHLC Function:
Computes OHLC values using linear regression if enabled. Otherwise, it returns the raw price values. This helps in reducing noise.
calcSignalLine Function:
Applies the chosen moving average (SMA, EMA, or WMA) to smooth the recalculated close values and generate a signal line.
getBaseCandleColor Function:
Determines the candle’s base color. It assigns buy/sell colors if specific crossover conditions are met; if not, it defaults to bullish (green) or bearish (red) based on the open/close relationship.
HMA Filter Calculations
HMA Computation:
The script calculates three HMAs (ma1, ma2, ma3) for different periods.
Trend Determination:
It sets a bullish condition (bcn) when ma3 is lower than both ma1 and ma2 with ma1 above ma2. Conversely, a bearish condition (scn) is set when ma3 is higher and the order of the HMAs indicates a downtrend.
Color Coding:
The HMA filter line color changes dynamically (green for bullish, red for bearish) based on these conditions.
Main Calculations
LinReg Candles:
Using the calcOHLC function, the script calculates the new open, high, low, and close values that reduce price noise.
Signal Line:
The signal line is computed on the basis of the smoothed close values using the selected moving average.
Buy/Sell Conditions:
Initial conditions are determined by checking if the recalculated close price crosses over (buy) or under (sell) the signal line.
The base candle color is then adjusted: if the HMA filter confirms the trend (bullish for buy or bearish for sell), the respective buy/sell colors are enforced.
A change in candle color compared to the previous bar triggers a buy or sell signal.
Plotting and Alerts
Visual Elements:
Background: Highlights the chart with a custom color when buy or sell conditions are met.
HMA Filter Line: Plotted (if enabled) with the dynamic color determined earlier.
Candles: The recalculated LinReg candles are drawn with colors based on the combined conditions.
Signal Line: Plotted over the candles with adjustable transparency and width.
Markers: Buy and sell markers are added to visually indicate signal points on the chart.
Alerts:
Alert conditions are set to trigger with predefined messages when a buy or sell signal is generated.
Modularity & Flexibility:
The code is structured with modular functions and clear grouping of inputs, making it highly customizable and user-friendly for open-source TradingView users.
Important how to track the real price on chart:
Locate the Chart Type Menu:
At the top of your TradingView chart, you’ll see a button showing the current chart type (likely a candlestick icon).
Select “Line” from the Dropdown:
Click that button and choose “Line” in the dropdown menu. This changes the main chart to a line chart of the real price.
Screenshots:

Cumulative Price Change AlertCumulative Price Change Alert
Version: 1.0
Author: QCodeTrader 🚀
Overview 🔍
The Cumulative Price Change Alert indicator analyzes the percentage change between the current and previous open prices and sums these changes over a user-defined number of bars. It then generates visual buy and sell signals using arrows and labels on the chart, helping traders spot cumulative price momentum and potential trading opportunities.
Key Features ⚙️
Customizable Timeframe 🕒:
Use a custom timeframe or default to the chart's timeframe for price data.
User-Defined Summation 🔢:
Specify the number of bars to sum, allowing you to analyze cumulative price changes.
Custom Buy & Sell Conditions 🔔:
Set individual percentage change thresholds and cumulative sum thresholds to tailor signals for
your strategy.
Visual Alerts 🚀:
Displays green upward arrows for buy signals and red downward arrows for sell signals directly
on the chart.
Informative Labels 📝:
Provides labels with formatted percentage change and cumulative sum details for the analyzed
bars.
Versatile Application 📊:
Suitable for stocks, forex, crypto, commodities, and more.
How It Works ⚡
Price Change Calculation ➗:
The indicator calculates the percentage change between the current bar's open price and the
previous bar's open price.
Cumulative Sum ➕:
It then sums these percentage changes over the last N bars (as specified by the user).
Signal Generation 🚦:
Buy Signal 🟢: When both the individual percentage change and the cumulative sum exceed
their respective buy thresholds, a green arrow and label are displayed.
Sell Signal 🔴: Conversely, if the individual change and cumulative sum fall below the sell
thresholds, a red arrow and label are shown.
How to Use 💡
Add the Indicator ➕:
Apply the indicator to your chart.
Customize Settings ⚙️:
Set a custom timeframe if desired.
Define the number of bars to sum.
Adjust the buy/sell percentage change and cumulative sum thresholds to match your trading
strategy.
Interpret Visual Cues 👀:
Monitor the chart for green or red arrows and corresponding labels that signal potential buy or
sell opportunities based on cumulative price movements.
Settings Explained 🛠️
Custom Timeframe:
Select an alternative timeframe for analysis, or leave empty to use the current chart's timeframe.
Number of Last Bars to Sum:
Determines how many bars are used to compute the cumulative percentage change.
Buy Condition - Min % Change:
The minimum individual percentage change required to consider a buy signal.
Buy Condition - Min Sum of Bars:
The minimum cumulative percentage change over the defined bars needed for a buy signal.
Sell Condition - Max % Change:
The maximum individual percentage change threshold for a sell signal.
Sell Condition - Max Sum of Bars:
The maximum cumulative percentage change over the defined bars for triggering a sell signal.
Best Use Cases 🎯
Momentum Identification 📈:
Quickly spot strong cumulative price movements and momentum shifts.
Entry/Exit Signals 🚪:
Use the visual signals to determine potential entry and exit points in your trading.
Versatile Strategy Application 🔄:
Effective for scalping, swing trading, and longer-term analysis across various markets.
UPD: uncheck labels for better performance

Orderblocks | iSolani
Revealing Institutional Footprints: The iSolani Volume-Powered Order Block System
Where Smart Money Leaves Its Mark – Automated Zone Detection for Discretionary Traders
Core Methodology
Pressure-Weighted Volume Analysis
Calculates directional commitment using candle position:
Buying Pressure = Total Volume × (Closing Price – Low) / (High – Low)
Selling Pressure = Total Volume × (High – Closing Price) / (High – Low)
Normalizes values against 31-period EMAs to filter retail noise
Adaptive Block Triggering
Identifies significant zones when:
Absolute Buy/Sell Difference > 4× SMA of Historical Differences (default)
Price closes bullishly (green block) or bearishly (red block)
Self-Maintaining Visualization
Blocks auto-extend rightward until price breaches critical level
Invalidated zones removed in real-time via array management
Technical Innovation
Dynamic Threshold Adjustment
Multiplier parameter (default 4) automatically scales with market volatility
Institutional-Grade Metrics
Blocks display:
Volume disparity in absolute terms
Percentage deviation from 33-period average
Directional bias through color-coding
Efficient Memory Handling
O(n) complexity cleanup routine prevents chart lag
System Workflow
Calculates real-time buy/sell pressure ratios
Compares to historical average (31-period default)
Generates semi-transparent zones (85% opacity) at spike locations
Monitors price interaction with block boundaries
Automatically retracts invalid zones
Standard Configuration
Sensitivity : 4× multiplier (ideal for 15m-4h charts)
Visuals : Red/green blocks with white text labels
Duration : 50-bar default extension
Volume Baseline : 33-period EMA filter
Boundary Check : Close beyond block high/low triggers deletion
This system transforms raw market data into a institutional roadmap – not by predicting turns, but by revealing where concentrated volume makes turns statistically probable. The color-coded blocks serve as persistent yet adaptive markers of where professional liquidity resides.
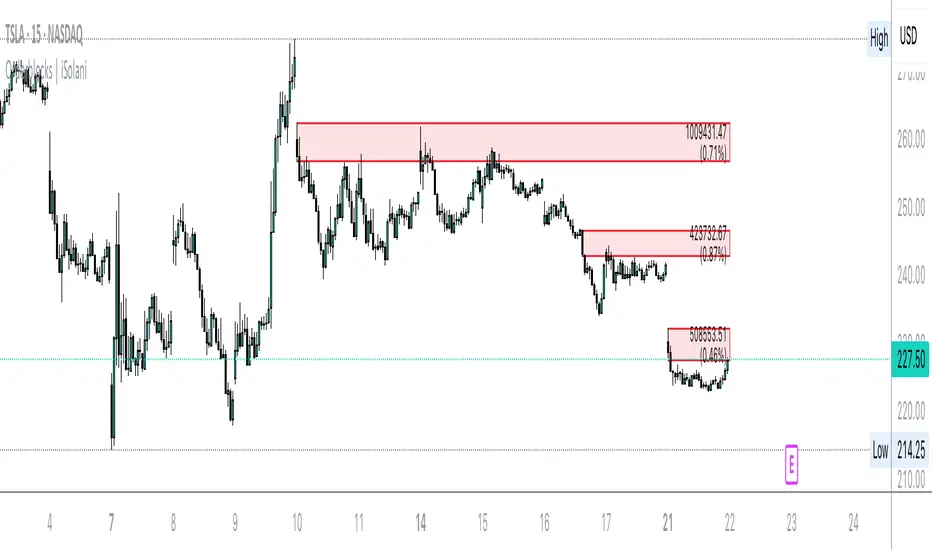
MTF Support & Resistance📌 Multi-Timeframe Support & Resistance (MTF S&R) Indicator
🔎 Overview:
The MTF Support & Resistance Indicator is a powerful tool designed to help traders identify critical price levels where the market is likely to react. This indicator automatically detects support and resistance zones based on a user-defined lookback period and extends these levels dynamically on the chart. Additionally, it provides multi-timeframe (MTF) support and resistance zones, allowing traders to view higher timeframe key levels alongside their current timeframe.
Support and resistance levels are crucial for traders as they help in determining potential reversal points, breakout zones, and trend continuation signals. By incorporating multi-timeframe analysis, this indicator enhances decision-making by providing a broader perspective of price action.
✨ Key Features & Benefits:
✅ Automatic Support & Resistance Detection – No need to manually plot levels; the indicator calculates them dynamically based on historical price action.
✅ Multi-Timeframe (MTF) Levels – Enables traders to see higher timeframe S&R levels on their current chart for better trend confirmation.
✅ Customizable Lookback Period – Adjust sensitivity by modifying the number of historical bars considered when calculating support and resistance.
✅ Color-Coded Visualization –
Green Line → Support on the current timeframe
Red Line → Resistance on the current timeframe
Dashed Blue Line → Higher timeframe support
Dashed Orange Line → Higher timeframe resistance
✅ Dynamic Extension of Levels – Levels extend left and right for better visibility across multiple bars.
✅ Real-Time Updates – Automatically refreshes as new price data comes in.
✅ Non-Repainting – Ensures reliable support and resistance levels that do not change after the bar closes.
📈 How to Use the Indicator:
Identify Key Price Levels:
The green line represents support, where price may bounce.
The red line represents resistance, where price may reject.
The blue dashed line represents support on a higher timeframe, making it a stronger level.
The orange dashed line represents higher timeframe resistance, helping identify major breakout zones.
Trend Trading:
Look for price action around these levels to confirm breakouts or reversals.
Combine with trend indicators (like moving averages) to validate trade entries.
Range Trading:
If the price is bouncing between support and resistance, consider range trading strategies (buying at support, selling at resistance).
Breakout Trading:
If the price breaks above resistance, it could indicate a bullish trend continuation.
If the price breaks below support, it could signal a bearish trend continuation.
⚙️ Indicator Settings:
Lookback Period: Determines the number of historical bars used to calculate support and resistance.
Show Higher Timeframe Levels (MTF): Enable/disable MTF support and resistance levels.
Extend Bars: Extends the drawn lines for better visualization.
Support/Resistance Colors: Allows users to customize the appearance of the lines.
⚠️ Important Notes:
This indicator does NOT generate buy/sell signals—it serves as a technical tool to improve trading analysis.
Best Used With Other Indicators: Consider combining it with volume, moving averages, RSI, or price action strategies for more reliable trade setups.
Works on Any Market & Timeframe: Forex, stocks, commodities, indices, and cryptocurrencies.
Use Higher Timeframe Levels for Stronger Confirmations: If a higher timeframe support/resistance level aligns with a lower timeframe level, it may indicate a stronger price reaction.
🎯 Who Should Use This Indicator?
📌 Scalpers & Day Traders – Identify short-term support and resistance levels for quick trades.
📌 Swing Traders – Utilize higher timeframe levels for position entries and exits.
📌 Trend Traders – Confirm breakout zones and key price levels for trend-following strategies.
📌 Reversal Traders – Spot potential reversal zones at significant S&R levels.